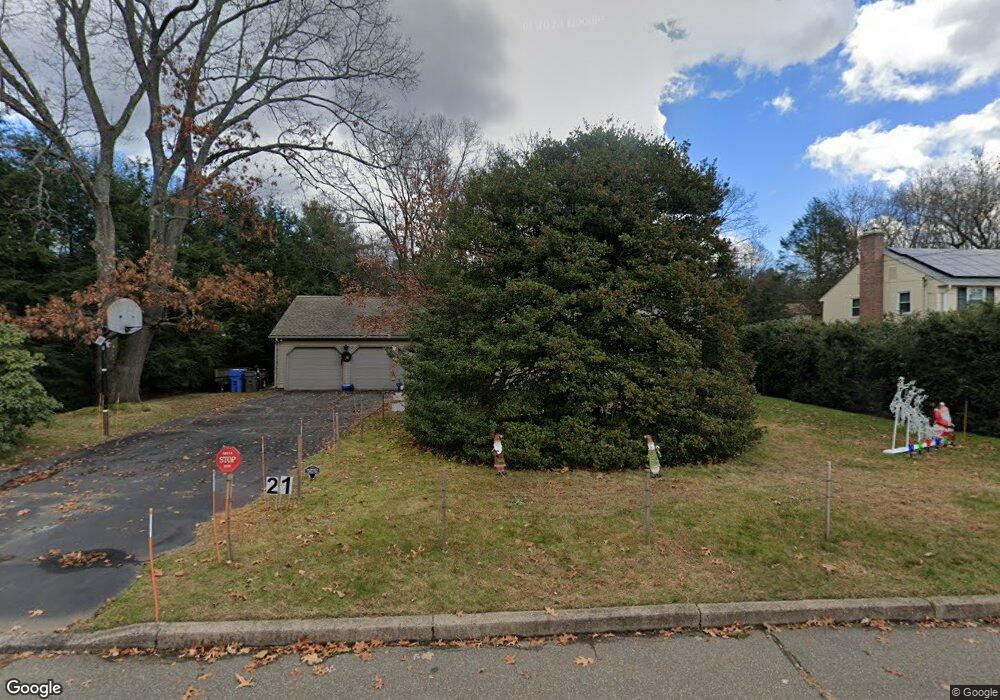
21 Duncan Rd Manchester, CT 06040
Martin NeighborhoodEstimated Value: $419,000 - $480,000
3
Beds
2
Baths
1,760
Sq Ft
$250/Sq Ft
Est. Value
About This Home
This home is located at 21 Duncan Rd, Manchester, CT 06040 and is currently estimated at $439,304, approximately $249 per square foot. 21 Duncan Rd is a home located in Hartford County with nearby schools including Martin Elementary School, Elisabeth M. Bennet Academy, and Illing Middle School.
Ownership History
Date
Name
Owned For
Owner Type
Purchase Details
Closed on
Nov 8, 1993
Sold by
Ryba Michael H and Ryba Tina W
Bought by
Pedneault Stephen A and Pedneault Kimberly A
Current Estimated Value
Purchase Details
Closed on
Sep 8, 1989
Sold by
Melroy John W
Bought by
Ryba Michael H
Create a Home Valuation Report for This Property
The Home Valuation Report is an in-depth analysis detailing your home's value as well as a comparison with similar homes in the area
Home Values in the Area
Average Home Value in this Area
Purchase History
| Date | Buyer | Sale Price | Title Company |
|---|---|---|---|
| Pedneault Stephen A | $175,000 | -- | |
| Pedneault Stephen A | $175,000 | -- | |
| Ryba Michael H | $235,000 | -- |
Source: Public Records
Mortgage History
| Date | Status | Borrower | Loan Amount |
|---|---|---|---|
| Closed | Ryba Michael H | $100,000 | |
| Closed | Ryba Michael H | $100,000 | |
| Closed | Ryba Michael H | $155,000 |
Source: Public Records
Tax History Compared to Growth
Tax History
| Year | Tax Paid | Tax Assessment Tax Assessment Total Assessment is a certain percentage of the fair market value that is determined by local assessors to be the total taxable value of land and additions on the property. | Land | Improvement |
|---|---|---|---|---|
| 2025 | $8,199 | $205,900 | $48,100 | $157,800 |
| 2024 | $7,964 | $205,900 | $48,100 | $157,800 |
| 2023 | $7,659 | $205,900 | $48,100 | $157,800 |
| 2022 | $7,437 | $205,900 | $48,100 | $157,800 |
| 2021 | $6,432 | $153,400 | $41,300 | $112,100 |
| 2020 | $6,423 | $153,400 | $41,300 | $112,100 |
| 2019 | $6,397 | $153,400 | $41,300 | $112,100 |
| 2018 | $6,276 | $153,400 | $41,300 | $112,100 |
| 2017 | $6,098 | $153,400 | $41,300 | $112,100 |
| 2016 | $6,448 | $162,500 | $54,400 | $108,100 |
| 2015 | $6,403 | $162,500 | $54,400 | $108,100 |
| 2014 | $6,281 | $162,500 | $54,400 | $108,100 |
Source: Public Records
Map
Nearby Homes