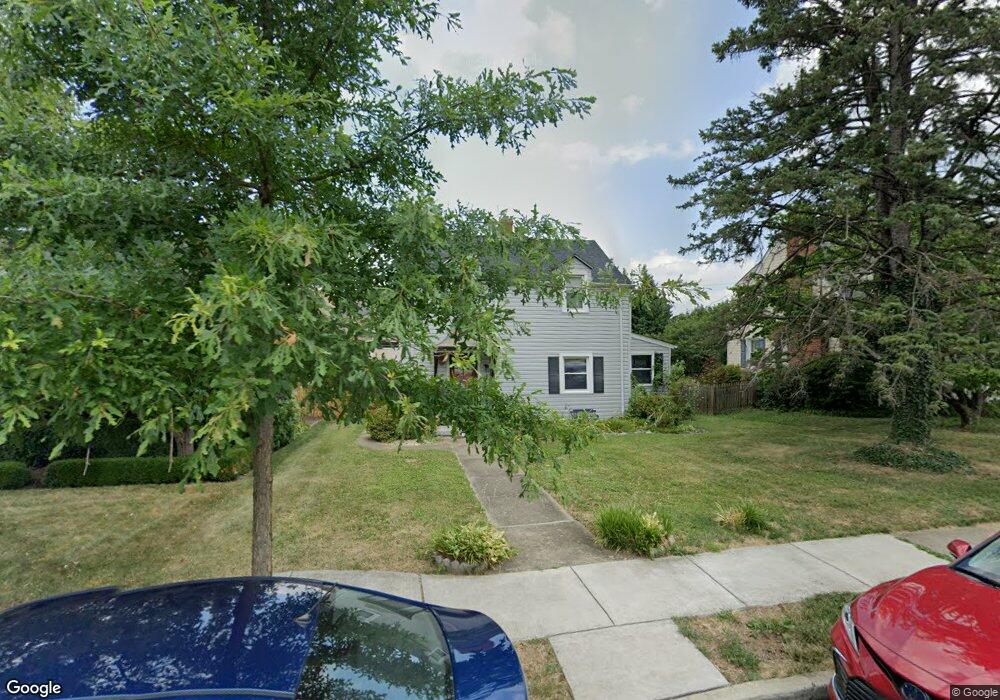
21 E 9th St Frederick, MD 21701
Selwyn Farms NeighborhoodEstimated Value: $246,000 - $347,000
Studio
1
Bath
960
Sq Ft
$313/Sq Ft
Est. Value
About This Home
This home is located at 21 E 9th St, Frederick, MD 21701 and is currently estimated at $300,945, approximately $313 per square foot. 21 E 9th St is a home located in Frederick County with nearby schools including North Frederick Elementary School, Gov. Thomas Johnson Middle School, and Gov. Thomas Johnson High School.
Ownership History
Date
Name
Owned For
Owner Type
Purchase Details
Closed on
Aug 22, 2024
Sold by
Oakes Teresa M
Bought by
Sappington Properties Llc
Current Estimated Value
Home Financials for this Owner
Home Financials are based on the most recent Mortgage that was taken out on this home.
Original Mortgage
$187,500
Outstanding Balance
$185,341
Interest Rate
6.78%
Mortgage Type
New Conventional
Estimated Equity
$115,604
Purchase Details
Closed on
Dec 15, 1998
Sold by
Gaver Paul E and Gaver Charlotte I
Bought by
Oakes Teresa M
Create a Home Valuation Report for This Property
The Home Valuation Report is an in-depth analysis detailing your home's value as well as a comparison with similar homes in the area
Home Values in the Area
Average Home Value in this Area
Purchase History
| Date | Buyer | Sale Price | Title Company |
|---|---|---|---|
| Sappington Properties Llc | $250,000 | None Listed On Document | |
| Oakes Teresa M | $101,000 | -- |
Source: Public Records
Mortgage History
| Date | Status | Borrower | Loan Amount |
|---|---|---|---|
| Open | Sappington Properties Llc | $187,500 | |
| Closed | Oakes Teresa M | -- |
Source: Public Records
Tax History
| Year | Tax Paid | Tax Assessment Tax Assessment Total Assessment is a certain percentage of the fair market value that is determined by local assessors to be the total taxable value of land and additions on the property. | Land | Improvement |
|---|---|---|---|---|
| 2025 | $3,976 | $232,300 | $105,000 | $127,300 |
| 2024 | $3,976 | $218,867 | $0 | $0 |
| 2023 | $3,682 | $205,433 | $0 | $0 |
| 2022 | $3,495 | $192,000 | $92,100 | $99,900 |
| 2021 | $3,283 | $186,300 | $0 | $0 |
| 2020 | $3,283 | $180,600 | $0 | $0 |
| 2019 | $952 | $174,900 | $86,100 | $88,800 |
| 2018 | $3,172 | $172,867 | $0 | $0 |
| 2017 | $3,104 | $174,900 | $0 | $0 |
| 2016 | $2,756 | $168,800 | $0 | $0 |
| 2015 | $2,756 | $166,300 | $0 | $0 |
| 2014 | $2,756 | $163,800 | $0 | $0 |
Source: Public Records
Map
Nearby Homes
Your Personal Tour Guide
Ask me questions while you tour the home.