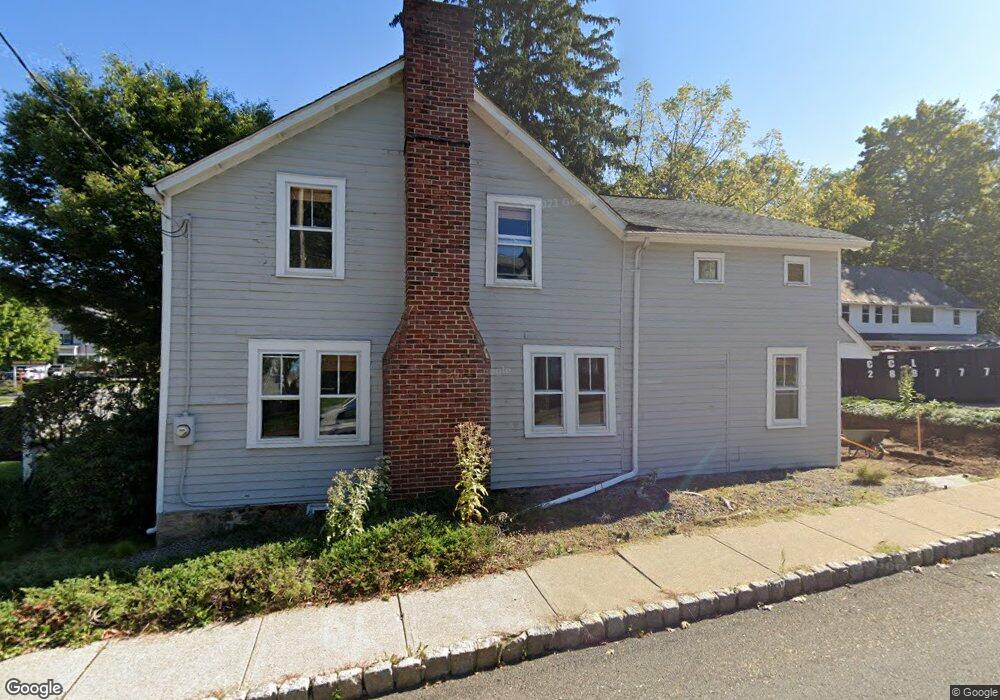
21 E Main St Mendham, NJ 07945
Estimated Value: $711,000 - $1,003,000
3
Beds
3
Baths
2,340
Sq Ft
$361/Sq Ft
Est. Value
About This Home
This home is located at 21 E Main St, Mendham, NJ 07945 and is currently estimated at $844,630, approximately $360 per square foot. 21 E Main St is a home located in Morris County with nearby schools including Hilltop Elementary School, Mountain View Middle School, and West Morris Mendham High School.
Ownership History
Date
Name
Owned For
Owner Type
Purchase Details
Closed on
Oct 21, 2022
Sold by
Ra Eugene and Ra Helen
Bought by
Citiland Food Inc
Current Estimated Value
Purchase Details
Closed on
Jul 16, 2021
Sold by
Schlott Richard L
Bought by
Ra Eugene and Ra Helen
Home Financials for this Owner
Home Financials are based on the most recent Mortgage that was taken out on this home.
Original Mortgage
$200,000
Interest Rate
2.8%
Mortgage Type
Seller Take Back
Purchase Details
Closed on
Jan 16, 1995
Sold by
Divelrsified N J Realty L P
Bought by
Schlott Richard
Create a Home Valuation Report for This Property
The Home Valuation Report is an in-depth analysis detailing your home's value as well as a comparison with similar homes in the area
Home Values in the Area
Average Home Value in this Area
Purchase History
| Date | Buyer | Sale Price | Title Company |
|---|---|---|---|
| Citiland Food Inc | -- | -- | |
| Ra Eugene | $405,000 | Green Hill Title Llc | |
| Schlott Richard | $430,000 | -- |
Source: Public Records
Mortgage History
| Date | Status | Borrower | Loan Amount |
|---|---|---|---|
| Previous Owner | Ra Eugene | $200,000 |
Source: Public Records
Tax History
| Year | Tax Paid | Tax Assessment Tax Assessment Total Assessment is a certain percentage of the fair market value that is determined by local assessors to be the total taxable value of land and additions on the property. | Land | Improvement |
|---|---|---|---|---|
| 2025 | $13,776 | $560,000 | $360,000 | $200,000 |
| 2024 | $12,270 | $560,000 | $360,000 | $200,000 |
Source: Public Records
Map
Nearby Homes
- 21 E Main St Unit 21
- 23 E Main St
- 23 E Main St
- 25 E Main St Unit 1
- 25 E Main St
- 20 E Main St
- 16 E Main St
- 19 E Main St Unit C
- 19 E Main St
- 19 E Main St Unit 3 (C)
- 15 E Main St Unit 3rd
- 15 E Main St Unit 1
- 15 E Main St
- 15 E Main St
- 27 E Main St
- 20 E Main St
- 22 E Main St
- 24 E Main St
- 13 E Main St
- 10 E Main St
Your Personal Tour Guide
Ask me questions while you tour the home.