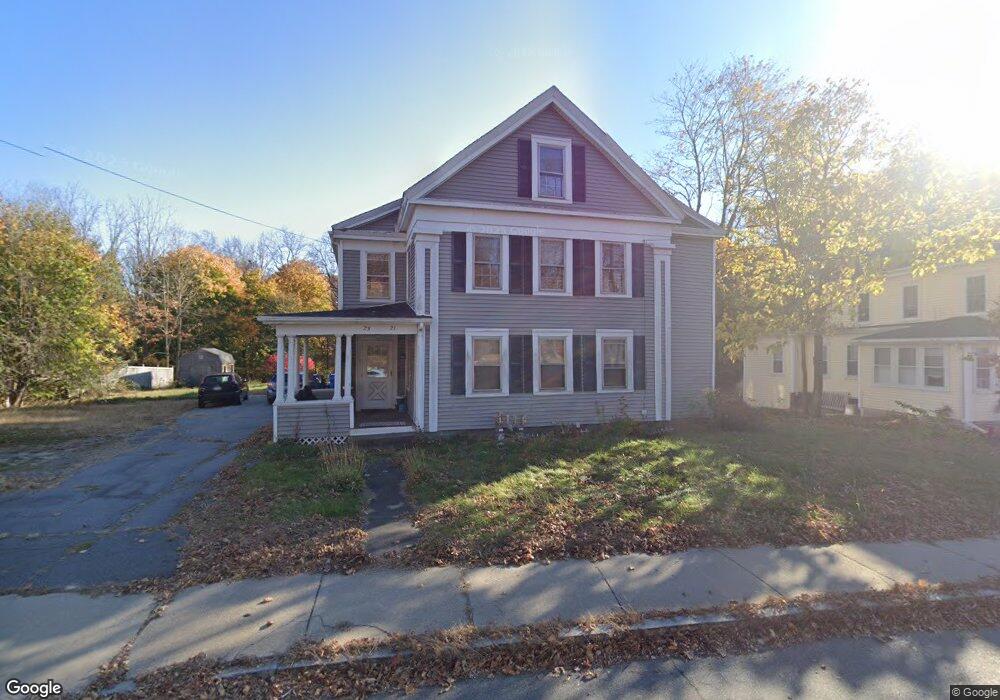
21 E Main St Unit 23 Merrimac, MA 01860
Estimated Value: $610,000 - $805,000
2
Beds
2
Baths
910
Sq Ft
$796/Sq Ft
Est. Value
About This Home
This home is located at 21 E Main St Unit 23, Merrimac, MA 01860 and is currently estimated at $723,960, approximately $795 per square foot. 21 E Main St Unit 23 is a home located in Essex County with nearby schools including Pentucket Regional High School.
Ownership History
Date
Name
Owned For
Owner Type
Purchase Details
Closed on
Jun 10, 2025
Sold by
Arnofsky Barry E and Arnofsky Sharen B
Bought by
Arnofsky
Current Estimated Value
Purchase Details
Closed on
Sep 21, 1992
Sold by
Federal Home Loan Mortgage Corporation
Bought by
Arnofsky Barry E and Arnofsky Sharen B
Purchase Details
Closed on
Apr 30, 1992
Sold by
Studer Frances B
Bought by
Fhlmc
Purchase Details
Closed on
Apr 16, 1987
Sold by
Carroll Derek V
Bought by
Studer Frances B
Create a Home Valuation Report for This Property
The Home Valuation Report is an in-depth analysis detailing your home's value as well as a comparison with similar homes in the area
Home Values in the Area
Average Home Value in this Area
Purchase History
| Date | Buyer | Sale Price | Title Company |
|---|---|---|---|
| Arnofsky | -- | -- | |
| Arnofsky | -- | -- | |
| Arnofsky | -- | -- | |
| Arnofsky Barry E | $50,470 | -- | |
| Arnofsky Barry E | $50,470 | -- | |
| Fhlmc | $137,921 | -- | |
| Fhlmc | $137,921 | -- | |
| Studer Frances B | $160,000 | -- |
Source: Public Records
Mortgage History
| Date | Status | Borrower | Loan Amount |
|---|---|---|---|
| Previous Owner | Studer Frances B | $150,000 | |
| Previous Owner | Studer Frances B | $225,000 | |
| Previous Owner | Studer Frances B | $116,205 |
Source: Public Records
Tax History Compared to Growth
Tax History
| Year | Tax Paid | Tax Assessment Tax Assessment Total Assessment is a certain percentage of the fair market value that is determined by local assessors to be the total taxable value of land and additions on the property. | Land | Improvement |
|---|---|---|---|---|
| 2025 | $8,941 | $674,800 | $330,300 | $344,500 |
| 2024 | $7,976 | $590,800 | $311,900 | $278,900 |
| 2023 | $7,825 | $529,800 | $264,200 | $265,600 |
| 2022 | $7,462 | $456,700 | $212,800 | $243,900 |
| 2021 | $7,270 | $446,000 | $194,500 | $251,500 |
| 2020 | $6,636 | $446,000 | $194,500 | $251,500 |
| 2019 | $6,444 | $407,600 | $168,800 | $238,800 |
| 2018 | $6,331 | $401,700 | $157,800 | $243,900 |
| 2017 | $6,144 | $376,000 | $132,100 | $243,900 |
| 2016 | $6,076 | $376,000 | $132,100 | $243,900 |
| 2015 | $5,822 | $358,300 | $132,100 | $226,200 |
| 2014 | $5,573 | $350,700 | $132,100 | $218,600 |
Source: Public Records
Map
Nearby Homes