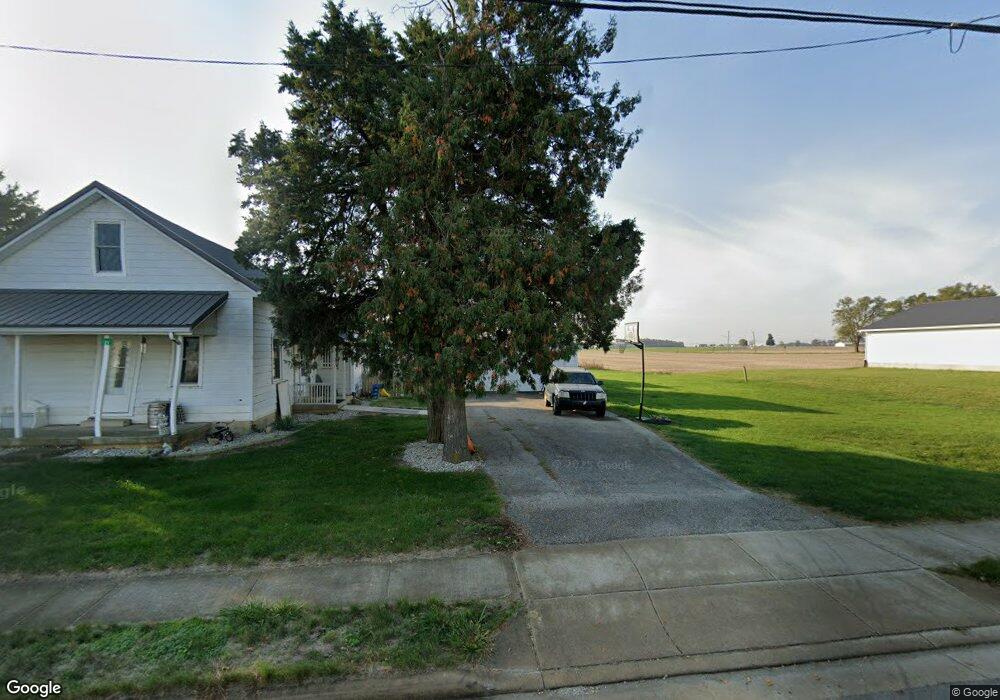
21 E Main St Yorkshire, OH 45388
Estimated Value: $83,000 - $213,000
3
Beds
1
Bath
1,180
Sq Ft
$110/Sq Ft
Est. Value
About This Home
This home is located at 21 E Main St, Yorkshire, OH 45388 and is currently estimated at $130,042, approximately $110 per square foot. 21 E Main St is a home with nearby schools including Versailles Elementary School, Versailles Middle School, and Versailles High School.
Ownership History
Date
Name
Owned For
Owner Type
Purchase Details
Closed on
Aug 20, 2021
Sold by
Hemmelgarn Lance and Hemmelgarn Karrie
Bought by
E & M Property Holdings Llc
Current Estimated Value
Home Financials for this Owner
Home Financials are based on the most recent Mortgage that was taken out on this home.
Original Mortgage
$48,000
Outstanding Balance
$30,062
Interest Rate
2.9%
Mortgage Type
Future Advance Clause Open End Mortgage
Estimated Equity
$99,980
Purchase Details
Closed on
May 4, 2005
Sold by
Batty Gary L and Batty Karen E
Bought by
Rinderle Christopher
Home Financials for this Owner
Home Financials are based on the most recent Mortgage that was taken out on this home.
Original Mortgage
$40,500
Interest Rate
6.05%
Mortgage Type
Fannie Mae Freddie Mac
Purchase Details
Closed on
Feb 13, 1992
Bought by
Rinderle Christopher
Create a Home Valuation Report for This Property
The Home Valuation Report is an in-depth analysis detailing your home's value as well as a comparison with similar homes in the area
Purchase History
| Date | Buyer | Sale Price | Title Company |
|---|---|---|---|
| E & M Property Holdings Llc | $60,000 | None Available | |
| Hemmelgarn Lance | $60,000 | None Available | |
| Rinderle Christopher | $45,000 | -- | |
| Rinderle Christopher | $27,300 | -- |
Source: Public Records
Mortgage History
| Date | Status | Borrower | Loan Amount |
|---|---|---|---|
| Open | E & M Property Holdings Llc | $48,000 | |
| Previous Owner | Rinderle Christopher | $40,500 |
Source: Public Records
Tax History
| Year | Tax Paid | Tax Assessment Tax Assessment Total Assessment is a certain percentage of the fair market value that is determined by local assessors to be the total taxable value of land and additions on the property. | Land | Improvement |
|---|---|---|---|---|
| 2024 | $857 | $26,760 | $6,400 | $20,360 |
| 2023 | $858 | $26,760 | $6,400 | $20,360 |
| 2022 | $619 | $19,140 | $5,370 | $13,770 |
| 2021 | $625 | $14,120 | $5,370 | $8,750 |
| 2020 | $498 | $14,120 | $5,370 | $8,750 |
| 2019 | $733 | $13,180 | $5,370 | $7,810 |
| 2018 | $1,060 | $13,180 | $5,370 | $7,810 |
| 2017 | $1,405 | $13,180 | $5,370 | $7,810 |
| 2016 | $1,129 | $15,830 | $5,420 | $10,410 |
| 2015 | $1,129 | $15,830 | $5,420 | $10,410 |
| 2014 | $1,242 | $15,830 | $5,420 | $10,410 |
| 2013 | $1,251 | $15,830 | $5,420 | $10,410 |
Source: Public Records
Map
Nearby Homes
- 157 Mendenhall Rd
- 159 Mendenhall Rd
- 158 Mendenhall Rd
- 155 Liberty Dr
- 156 Veterans Dr
- 136 Liberty Dr
- 154 Liberty Dr
- 135 Veterans Dr
- 151 Brewer Dr
- 145 Liberty Dr
- 150 Brewer Dr
- 143 Liberty Dr
- 149 Brewer Dr
- 139 Liberty Dr
- 148 Brewer Dr
- 138 Liberty Dr
- 137 Liberty Dr
- 140 Liberty Dr
- 144 Liberty Dr
- 146 Liberty Dr
Your Personal Tour Guide
Ask me questions while you tour the home.