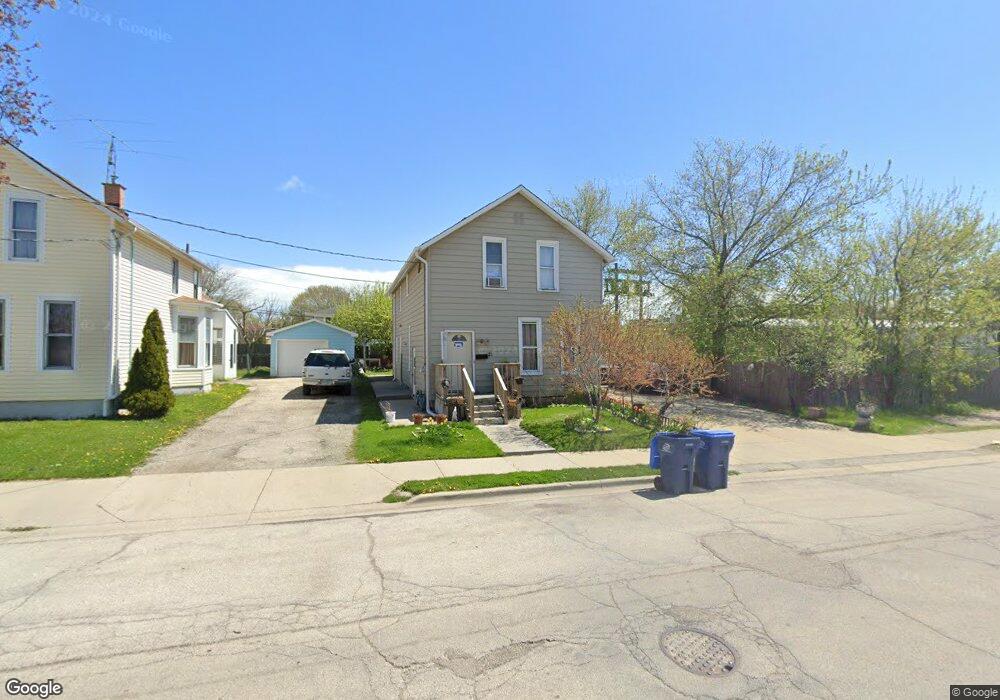
21 Edison Ct Waukegan, IL 60085
Lyon Grove NeighborhoodEstimated Value: $232,000 - $268,000
4
Beds
2
Baths
1,694
Sq Ft
$147/Sq Ft
Est. Value
About This Home
This home is located at 21 Edison Ct, Waukegan, IL 60085 and is currently estimated at $248,415, approximately $146 per square foot. 21 Edison Ct is a home located in Lake County with nearby schools including Hyde Park Elementary School, Miguel Juarez Middle School, and Waukegan High School.
Ownership History
Date
Name
Owned For
Owner Type
Purchase Details
Closed on
Feb 5, 2008
Sold by
Rodriguez Alvaro
Bought by
Flores Alfonso
Current Estimated Value
Purchase Details
Closed on
May 30, 2007
Sold by
Pizano Jose L and Pizano Silvia
Bought by
Rodriguez Alvaro
Home Financials for this Owner
Home Financials are based on the most recent Mortgage that was taken out on this home.
Original Mortgage
$156,750
Interest Rate
9.26%
Mortgage Type
Commercial
Purchase Details
Closed on
Jun 11, 1998
Sold by
Pizano Jose L and Pizano Silvia
Bought by
Pizano Jose L and Pizano Silvia
Home Financials for this Owner
Home Financials are based on the most recent Mortgage that was taken out on this home.
Original Mortgage
$85,833
Interest Rate
7.17%
Mortgage Type
FHA
Purchase Details
Closed on
Oct 22, 1993
Sold by
Santiago Abraham C and Santiago Flor
Bought by
Pizano Jose L and Pizano Silvia
Home Financials for this Owner
Home Financials are based on the most recent Mortgage that was taken out on this home.
Original Mortgage
$86,100
Interest Rate
7.02%
Mortgage Type
FHA
Create a Home Valuation Report for This Property
The Home Valuation Report is an in-depth analysis detailing your home's value as well as a comparison with similar homes in the area
Home Values in the Area
Average Home Value in this Area
Purchase History
| Date | Buyer | Sale Price | Title Company |
|---|---|---|---|
| Flores Alfonso | -- | None Available | |
| Rodriguez Alvaro | $165,000 | Ticor | |
| Pizano Jose L | -- | Chicago Title Insurance Co | |
| Pizano Jose L | $58,666 | -- |
Source: Public Records
Mortgage History
| Date | Status | Borrower | Loan Amount |
|---|---|---|---|
| Previous Owner | Rodriguez Alvaro | $156,750 | |
| Previous Owner | Pizano Jose L | $85,833 | |
| Previous Owner | Pizano Jose L | $86,100 |
Source: Public Records
Tax History Compared to Growth
Tax History
| Year | Tax Paid | Tax Assessment Tax Assessment Total Assessment is a certain percentage of the fair market value that is determined by local assessors to be the total taxable value of land and additions on the property. | Land | Improvement |
|---|---|---|---|---|
| 2024 | $4,117 | $62,949 | $6,944 | $56,005 |
| 2023 | $3,729 | $51,662 | $5,699 | $45,963 |
| 2022 | $3,729 | $44,139 | $5,709 | $38,430 |
| 2021 | $3,309 | $37,736 | $4,900 | $32,836 |
| 2020 | $3,305 | $35,156 | $4,565 | $30,591 |
| 2019 | $3,274 | $32,215 | $4,183 | $28,032 |
| 2018 | $2,168 | $23,151 | $4,736 | $18,415 |
| 2017 | $2,060 | $20,482 | $4,190 | $16,292 |
| 2016 | $1,823 | $17,798 | $3,641 | $14,157 |
| 2015 | $1,677 | $15,930 | $3,259 | $12,671 |
| 2014 | $2,976 | $23,127 | $3,739 | $19,388 |
| 2012 | $3,908 | $25,057 | $4,051 | $21,006 |
Source: Public Records
Map
Nearby Homes
- 23 N Jackson St
- 1416 Hamilton Ct
- 28 N Saint James St
- 1521 Catalpa Ave
- 613 Washington St
- 610 Bluff St
- 557 W Water St
- 304 Powell Ave
- 215 S Park Ave
- 613 Clarke Ave
- 305 Besley Place
- 49 S Lewis Ave
- 408 Besley Place
- 511 Chestnut St
- 428 N Poplar St
- 446 S Jackson St
- 522 N Poplar St
- 452 North Ave
- 502 Belvidere Rd
- 702 Franklin St
- 25 Edison Ct
- 29 Edison Ct
- 16 N Jackson St
- 22 N Jackson St
- 28 N Jackson St
- 33 Edison Ct
- 32 N Jackson St
- 36 N Jackson St
- 21 Jefferson Ave
- 25 Jefferson Ave
- 11 Jefferson Ave
- 29 Jefferson Ave
- 40 N Jackson St
- 17 Jefferson Ave
- 17 Jefferson Ave Unit 2F
- 17 Jefferson Ave Unit 1F
- 31 Jefferson Ave
- 33 Jefferson Ave
- 19 N Jackson St
- 1220 Washington St