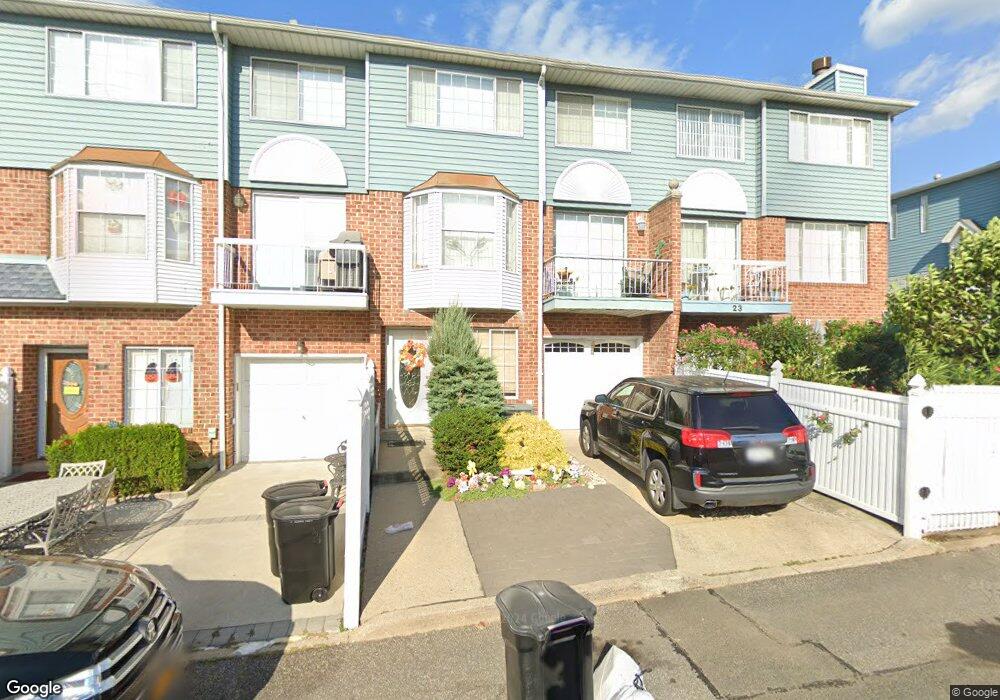
21 Edward Ct Staten Island, NY 10314
New Springville NeighborhoodEstimated Value: $532,000 - $620,000
--
Bed
4
Baths
1,600
Sq Ft
$363/Sq Ft
Est. Value
About This Home
This home is located at 21 Edward Ct, Staten Island, NY 10314 and is currently estimated at $580,546, approximately $362 per square foot. 21 Edward Ct is a home located in Richmond County with nearby schools including P.S. 69 - Daniel D. Tompkins, Is 72 Rocco Laurie, and Susan E Wagner High School.
Ownership History
Date
Name
Owned For
Owner Type
Purchase Details
Closed on
Jul 17, 2020
Sold by
Marchese Philip D and Marchese Frances
Bought by
Venditti Daniel
Current Estimated Value
Home Financials for this Owner
Home Financials are based on the most recent Mortgage that was taken out on this home.
Original Mortgage
$260,000
Outstanding Balance
$230,119
Interest Rate
3%
Mortgage Type
New Conventional
Estimated Equity
$350,427
Purchase Details
Closed on
Feb 11, 2008
Sold by
Marchese Frances
Bought by
Marchese Frances and Marchese Philip D
Home Financials for this Owner
Home Financials are based on the most recent Mortgage that was taken out on this home.
Original Mortgage
$517,500
Interest Rate
3.99%
Mortgage Type
Reverse Mortgage Home Equity Conversion Mortgage
Purchase Details
Closed on
Nov 5, 1996
Sold by
Veneziano Pasquale and Ziegelman Cynthia
Bought by
Marchese Frances
Create a Home Valuation Report for This Property
The Home Valuation Report is an in-depth analysis detailing your home's value as well as a comparison with similar homes in the area
Home Values in the Area
Average Home Value in this Area
Purchase History
| Date | Buyer | Sale Price | Title Company |
|---|---|---|---|
| Venditti Daniel | -- | Clearpoint Title Agency Llc | |
| Marchese Frances | -- | Fidelity National Title Insu | |
| Marchese Frances | $125,000 | -- |
Source: Public Records
Mortgage History
| Date | Status | Borrower | Loan Amount |
|---|---|---|---|
| Open | Venditti Daniel | $260,000 | |
| Previous Owner | Marchese Frances | $517,500 |
Source: Public Records
Tax History Compared to Growth
Tax History
| Year | Tax Paid | Tax Assessment Tax Assessment Total Assessment is a certain percentage of the fair market value that is determined by local assessors to be the total taxable value of land and additions on the property. | Land | Improvement |
|---|---|---|---|---|
| 2025 | $4,772 | $35,220 | $3,031 | $32,189 |
| 2024 | $4,772 | $28,800 | $3,564 | $25,236 |
| 2023 | $4,808 | $23,674 | $3,409 | $20,265 |
| 2022 | $4,619 | $28,380 | $4,320 | $24,060 |
| 2021 | $4,593 | $29,940 | $4,320 | $25,620 |
| 2020 | $1,520 | $27,540 | $4,320 | $23,220 |
| 2019 | $1,412 | $27,360 | $4,320 | $23,040 |
| 2018 | $1,352 | $19,728 | $3,808 | $15,920 |
| 2017 | $2,481 | $19,280 | $4,119 | $15,161 |
| 2016 | $1,197 | $18,189 | $3,968 | $14,221 |
| 2015 | $975 | $17,160 | $3,600 | $13,560 |
| 2014 | $975 | $16,500 | $3,600 | $12,900 |
Source: Public Records
Map
Nearby Homes
- 222 Monahan Ave
- 186 Monahan Ave
- 101 McVeigh Ave
- 181 McVeigh Ave
- 11 Shirra Ave Unit A
- 20 Sweetgum Ln
- 333 Travis Ave
- 107 Denker Place
- 28A Mcdivitt Ave Unit 11
- 8 Mcdivitt Ave Unit A
- 143 Monahan Ave
- 45 Braisted Ave
- 43 Shirra Ave Unit 255
- 29 Shirra Ave Unit 249
- 611 Klondike Ave
- 619 Klondike Ave
- 127 Keating Place
- 44 McVeigh Ave
- 22 Braisted Ave
- 187 Keating Place