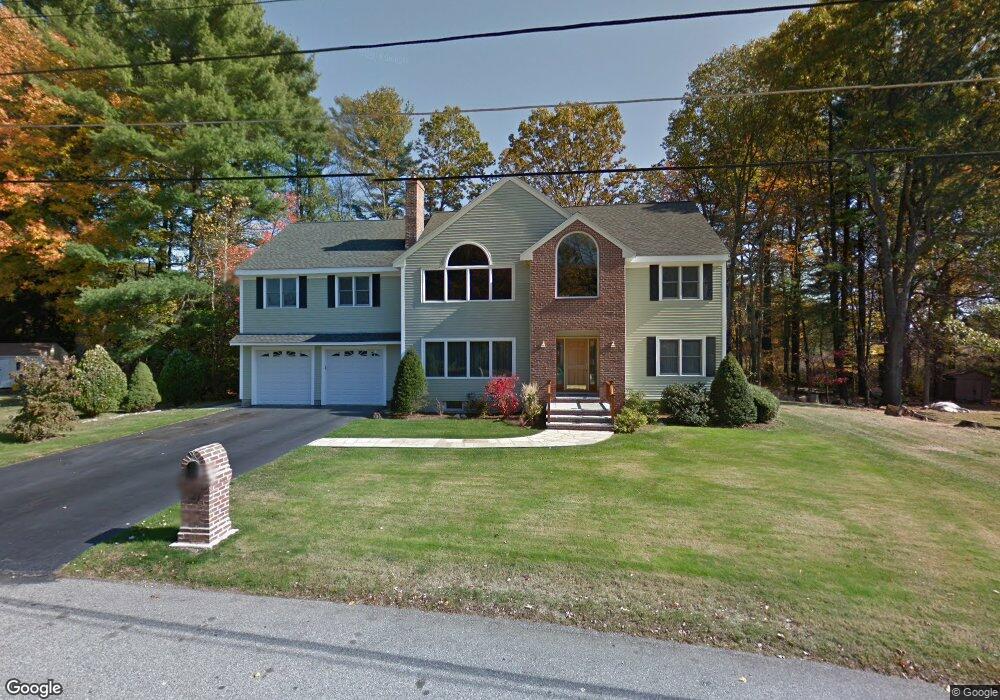
21 Ellen Rd Burlington, MA 01803
North Burlington NeighborhoodEstimated Value: $917,000 - $1,248,000
4
Beds
3
Baths
3,488
Sq Ft
$318/Sq Ft
Est. Value
About This Home
This home is located at 21 Ellen Rd, Burlington, MA 01803 and is currently estimated at $1,110,716, approximately $318 per square foot. 21 Ellen Rd is a home located in Middlesex County with nearby schools including Burlington High School, Marshall Simonds Middle School, and Mount Hope Christian School.
Ownership History
Date
Name
Owned For
Owner Type
Purchase Details
Closed on
Jul 28, 2009
Sold by
Rosario Urdi T and Urdi Rosario
Bought by
Urdi Paul
Current Estimated Value
Purchase Details
Closed on
Mar 31, 2006
Sold by
Urdi Paul and Urdi Rosario
Bought by
Urdi Mary and Urdi Paul
Purchase Details
Closed on
Feb 24, 2004
Sold by
Urdi Denise and Urdi Paul
Bought by
Urdi Paul and Urdi Rosario
Purchase Details
Closed on
Oct 28, 1999
Sold by
Alicata Ft and Alicata James P
Bought by
Urdi Paul and Urdi Denise
Home Financials for this Owner
Home Financials are based on the most recent Mortgage that was taken out on this home.
Original Mortgage
$163,000
Interest Rate
7.78%
Mortgage Type
Purchase Money Mortgage
Create a Home Valuation Report for This Property
The Home Valuation Report is an in-depth analysis detailing your home's value as well as a comparison with similar homes in the area
Home Values in the Area
Average Home Value in this Area
Purchase History
| Date | Buyer | Sale Price | Title Company |
|---|---|---|---|
| Urdi Paul | -- | -- | |
| Urdi Mary | -- | -- | |
| Urdi Paul | -- | -- | |
| Urdi Paul | $243,000 | -- |
Source: Public Records
Mortgage History
| Date | Status | Borrower | Loan Amount |
|---|---|---|---|
| Previous Owner | Urdi Paul | $163,000 |
Source: Public Records
Tax History Compared to Growth
Tax History
| Year | Tax Paid | Tax Assessment Tax Assessment Total Assessment is a certain percentage of the fair market value that is determined by local assessors to be the total taxable value of land and additions on the property. | Land | Improvement |
|---|---|---|---|---|
| 2025 | $8,741 | $1,009,400 | $425,100 | $584,300 |
| 2024 | $8,487 | $949,300 | $403,100 | $546,200 |
| 2023 | $8,348 | $888,100 | $350,100 | $538,000 |
| 2022 | $8,052 | $809,200 | $319,100 | $490,100 |
| 2021 | $5,801 | $780,200 | $290,100 | $490,100 |
| 2020 | $7,521 | $780,200 | $290,100 | $490,100 |
| 2019 | $17,740 | $704,200 | $271,100 | $433,100 |
| 2018 | $7,255 | $682,900 | $258,100 | $424,800 |
| 2017 | $7,072 | $682,900 | $258,100 | $424,800 |
| 2016 | $7,019 | $612,500 | $220,100 | $392,400 |
| 2015 | $6,952 | $612,500 | $220,100 | $392,400 |
| 2014 | $6,887 | $573,900 | $200,100 | $373,800 |
Source: Public Records
Map
Nearby Homes