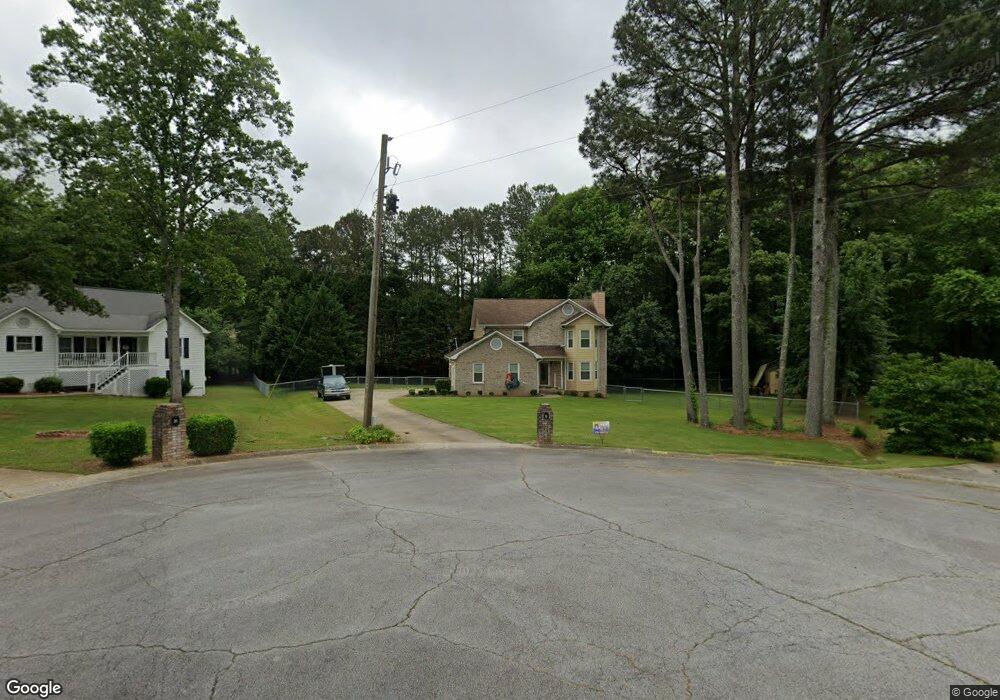
21 Esasky Ct Unit 19 Carrollton, GA 30116
Abilene NeighborhoodEstimated Value: $290,000 - $352,000
3
Beds
3
Baths
2,057
Sq Ft
$155/Sq Ft
Est. Value
About This Home
This home is located at 21 Esasky Ct Unit 19, Carrollton, GA 30116 and is currently estimated at $317,879, approximately $154 per square foot. 21 Esasky Ct Unit 19 is a home located in Carroll County with nearby schools including Sand Hill Elementary School, Bay Springs Middle School, and Villa Rica High School.
Ownership History
Date
Name
Owned For
Owner Type
Purchase Details
Closed on
Aug 27, 2014
Sold by
Davis Raymond E
Bought by
Dobbs Kenneth and Dobbs Tammy M
Current Estimated Value
Home Financials for this Owner
Home Financials are based on the most recent Mortgage that was taken out on this home.
Original Mortgage
$127,551
Outstanding Balance
$97,829
Interest Rate
4.19%
Mortgage Type
New Conventional
Estimated Equity
$220,050
Purchase Details
Closed on
Mar 1, 2013
Sold by
Gray Linda T
Bought by
Davis Raymond E and Davis Patricia E
Home Financials for this Owner
Home Financials are based on the most recent Mortgage that was taken out on this home.
Original Mortgage
$76,000
Interest Rate
3.56%
Mortgage Type
New Conventional
Purchase Details
Closed on
Feb 26, 2001
Sold by
Gray Anthony L and Gray Lin
Bought by
Gray Linda T
Purchase Details
Closed on
Oct 22, 1998
Sold by
Mackel Thomas and A W
Bought by
Gray Anthony L and Gray Lin
Purchase Details
Closed on
Dec 8, 1989
Bought by
Mackel Thomas and A W
Create a Home Valuation Report for This Property
The Home Valuation Report is an in-depth analysis detailing your home's value as well as a comparison with similar homes in the area
Home Values in the Area
Average Home Value in this Area
Purchase History
| Date | Buyer | Sale Price | Title Company |
|---|---|---|---|
| Dobbs Kenneth | $125,000 | -- | |
| Davis Raymond E | $95,000 | -- | |
| Gray Linda T | -- | -- | |
| Gray Anthony L | $94,000 | -- | |
| Mackel Thomas | -- | -- |
Source: Public Records
Mortgage History
| Date | Status | Borrower | Loan Amount |
|---|---|---|---|
| Open | Dobbs Kenneth | $127,551 | |
| Previous Owner | Davis Raymond E | $76,000 |
Source: Public Records
Tax History Compared to Growth
Tax History
| Year | Tax Paid | Tax Assessment Tax Assessment Total Assessment is a certain percentage of the fair market value that is determined by local assessors to be the total taxable value of land and additions on the property. | Land | Improvement |
|---|---|---|---|---|
| 2024 | $2,254 | $123,521 | $8,000 | $115,521 |
| 2023 | $2,254 | $113,038 | $8,000 | $105,038 |
| 2022 | $1,914 | $92,236 | $8,000 | $84,236 |
| 2021 | $1,744 | $80,193 | $8,000 | $72,193 |
| 2020 | $1,595 | $71,814 | $8,000 | $63,814 |
| 2019 | $1,504 | $66,200 | $8,000 | $58,200 |
| 2018 | $1,392 | $58,947 | $8,000 | $50,947 |
| 2017 | $1,287 | $52,848 | $6,000 | $46,848 |
| 2016 | $1,393 | $52,848 | $6,000 | $46,848 |
| 2015 | $1,361 | $48,668 | $6,000 | $42,668 |
| 2014 | $1,067 | $44,401 | $6,000 | $38,401 |
Source: Public Records
Map
Nearby Homes
- 0 Georgia 166 Unit 23176369
- 105 Red Oak Dr
- 185 Diamond Ct
- 227 Diamond Ct
- 137 Fawn Dr
- 100 Cross Plains Hulett Rd
- 2058 Sewanee Ct
- 1645 Four Notch Rd
- 2513 N Carroll Ct
- 2025 Lakeview Pkwy
- 2114 Lakeview Pkwy
- 278 Sandhill Hulett Rd
- 140 Fairfield Rd
- 128 Jasmine Way
- 2219 Harper Dr
- 2191 Lakeview Pkwy
- 135 Jasmine Way