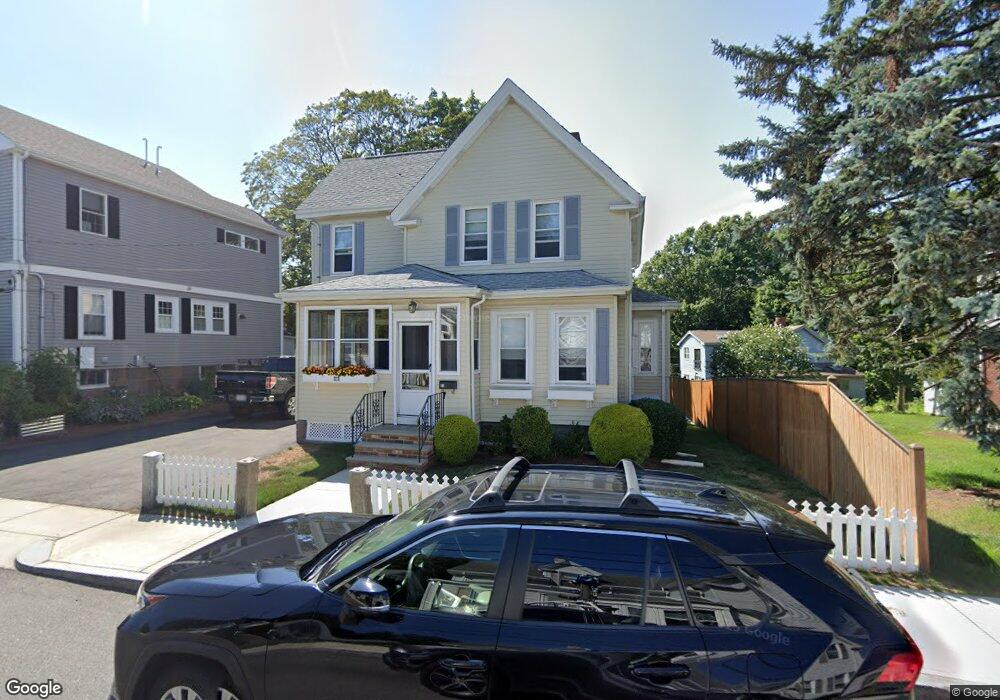
21 Farrell St Quincy, MA 02169
Quincy Center NeighborhoodEstimated Value: $655,707 - $921,000
3
Beds
2
Baths
1,249
Sq Ft
$623/Sq Ft
Est. Value
About This Home
This home is located at 21 Farrell St, Quincy, MA 02169 and is currently estimated at $777,927, approximately $622 per square foot. 21 Farrell St is a home located in Norfolk County with nearby schools including Charles A. Bernazzani Elementary School, Central Middle School, and Quincy High School.
Ownership History
Date
Name
Owned For
Owner Type
Purchase Details
Closed on
May 13, 2021
Sold by
Mollins Robert M and Mollins Theresa F
Bought by
Mollins Irt
Current Estimated Value
Purchase Details
Closed on
Jul 31, 1989
Sold by
Smith Raymond M
Bought by
Mollins Robert M
Home Financials for this Owner
Home Financials are based on the most recent Mortgage that was taken out on this home.
Original Mortgage
$132,750
Interest Rate
9.9%
Mortgage Type
Purchase Money Mortgage
Create a Home Valuation Report for This Property
The Home Valuation Report is an in-depth analysis detailing your home's value as well as a comparison with similar homes in the area
Home Values in the Area
Average Home Value in this Area
Purchase History
| Date | Buyer | Sale Price | Title Company |
|---|---|---|---|
| Mollins Irt | -- | None Available | |
| Mollins Robert M | $147,500 | -- |
Source: Public Records
Mortgage History
| Date | Status | Borrower | Loan Amount |
|---|---|---|---|
| Previous Owner | Mollins Robert M | $120,000 | |
| Previous Owner | Mollins Robert M | $30,000 | |
| Previous Owner | Mollins Robert M | $127,000 | |
| Previous Owner | Mollins Robert M | $132,750 |
Source: Public Records
Tax History Compared to Growth
Tax History
| Year | Tax Paid | Tax Assessment Tax Assessment Total Assessment is a certain percentage of the fair market value that is determined by local assessors to be the total taxable value of land and additions on the property. | Land | Improvement |
|---|---|---|---|---|
| 2025 | $6,043 | $524,100 | $271,400 | $252,700 |
| 2024 | $5,654 | $501,700 | $258,500 | $243,200 |
| 2023 | $5,181 | $465,500 | $235,000 | $230,500 |
| 2022 | $5,276 | $440,400 | $213,600 | $226,800 |
| 2021 | $5,037 | $414,900 | $213,600 | $201,300 |
| 2020 | $4,838 | $389,200 | $203,400 | $185,800 |
| 2019 | $4,701 | $374,600 | $191,900 | $182,700 |
| 2018 | $4,765 | $357,200 | $191,900 | $165,300 |
| 2017 | $4,767 | $336,400 | $182,800 | $153,600 |
| 2016 | $4,562 | $317,700 | $174,100 | $143,600 |
| 2015 | $4,466 | $305,900 | $174,100 | $131,800 |
| 2014 | $4,196 | $282,400 | $165,800 | $116,600 |
Source: Public Records
Map
Nearby Homes
- 1 Cityview Ln Unit 204
- 1 Cityview Ln Unit 506
- 1 Cityview Ln Unit 303
- 25 Carrolls Ln
- 312 Adams St
- 73 Cranch St Unit 73
- 118 Dimmock St
- 46 Suomi Rd
- 46 Suomi Rd Unit 46
- 73 Scotch Pond Place
- 14 Priscilla Ln
- 89 Puritan Dr
- 293 Whitwell St
- 41 Filbert St
- 57 Buckley St
- 195 Thomas Burgin Pkwy Unit 205
- 9 Cross St Unit 11
- 9 Common St Unit 3
- 165 Granite St
- 56 Town Hill St Unit 56
- 15 Farrell St
- 25 Farrell St
- 34 Mattson St
- 34 Mattson St Unit 1
- 11 Farrell St
- 31 Farrell St
- 22 Farrell St
- 26 Farrell St
- 23 Curtis St
- 16 Farrell St Unit 2
- 16 Farrell St
- 16 Farrell St Unit 1-Right
- 26 Mattson St
- 9 Farrell St
- 10 Farrell St
- 12 Farrell St Unit 2/F
- 10 Farrell St Unit 1
- 12 Farrell St
- 19 Curtis St
- 45 Curtis St