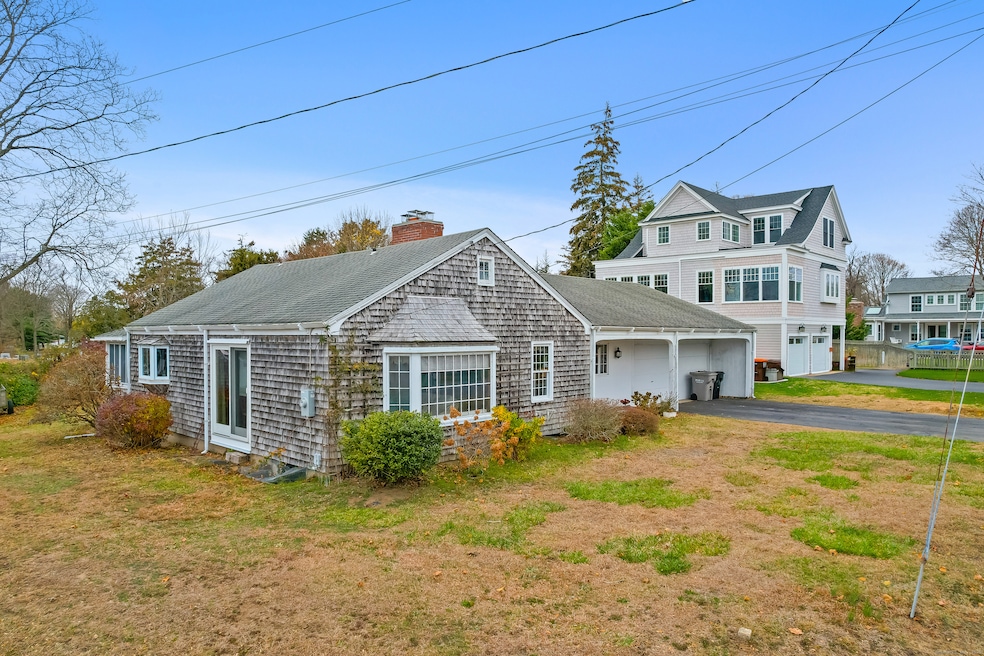

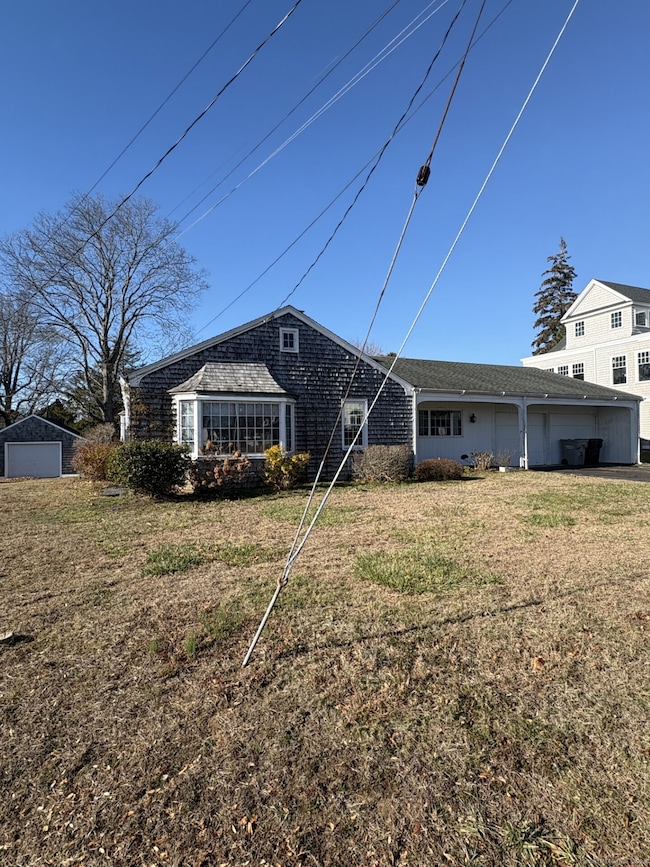
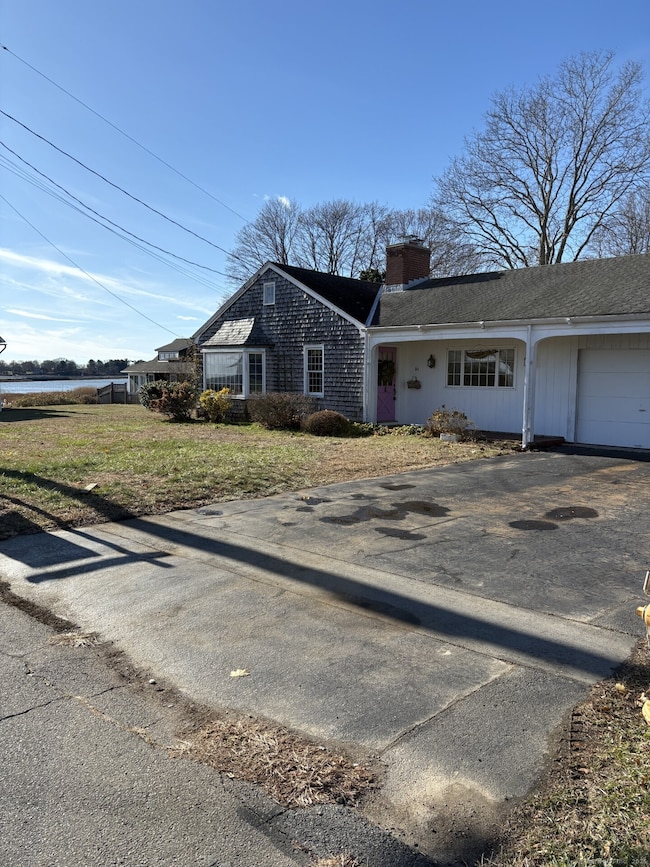
21 Fenwick St Old Saybrook, CT 06475
Estimated payment $4,742/month
Highlights
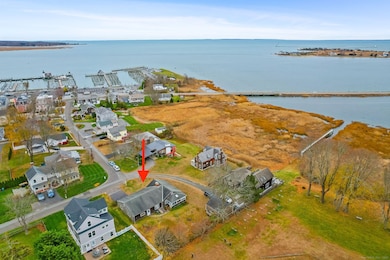
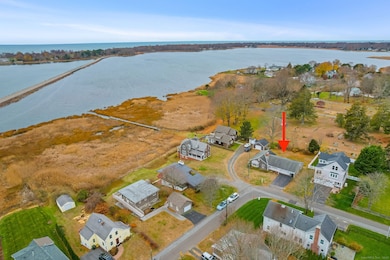
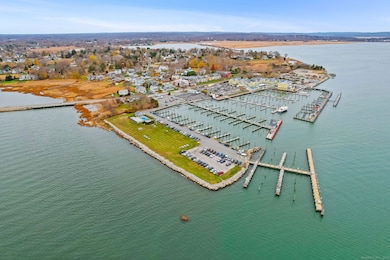
- Waterfront
- Ranch Style House
- 1 Fireplace
- Kathleen E. Goodwin School Rated A-
- Attic
- 4-minute walk to Fort Saybrook Monument Park
About This Home
This home is being sold "AS IS".Right place at the right time! This home now wants a new owner. Renovations are needed but location, location, location.Water views with walking ability to Saybrook Point and Fenwick golf course. Ranch with 3 beds and 2 baths. This is an opportunity to enjoy Old Saybrook at its best.
Listing Agent
Berkshire Hathaway NE Prop. Brokerage Phone: (860) 575-5559 License #RES.0764016 Listed on: 11/05/2025

Home Details
Home Type
- Single Family
Est. Annual Taxes
- $6,561
Year Built
- Built in 1938
Lot Details
- 8,276 Sq Ft Lot
- Waterfront
Parking
- 2 Car Garage
Home Design
- Ranch Style House
- Concrete Foundation
- Frame Construction
- Asphalt Shingled Roof
- Shingle Siding
Interior Spaces
- 1,432 Sq Ft Home
- 1 Fireplace
- Water Views
- Basement Fills Entire Space Under The House
- Attic or Crawl Hatchway Insulated
- Microwave
Bedrooms and Bathrooms
- 3 Bedrooms
- 2 Full Bathrooms
Laundry
- Laundry on main level
- Dryer
- Washer
Schools
- Kathleen E. Goodwin Elementary School
- Old Saybrook High School
Utilities
- Central Air
- Heating System Uses Oil
- Fuel Tank Located in Basement
Listing and Financial Details
- Assessor Parcel Number 1026175
Map
Home Values in the Area
Average Home Value in this Area
Tax History
| Year | Tax Paid | Tax Assessment Tax Assessment Total Assessment is a certain percentage of the fair market value that is determined by local assessors to be the total taxable value of land and additions on the property. | Land | Improvement |
|---|---|---|---|---|
| 2025 | $6,561 | $423,300 | $216,700 | $206,600 |
| 2024 | $6,434 | $423,300 | $216,700 | $206,600 |
| 2023 | $5,329 | $260,600 | $126,500 | $134,100 |
| 2022 | $5,233 | $260,600 | $126,500 | $134,100 |
| 2021 | $5,127 | $255,700 | $126,500 | $129,200 |
| 2020 | $5,127 | $255,700 | $126,500 | $129,200 |
| 2019 | $5,050 | $255,700 | $126,500 | $129,200 |
| 2018 | $4,978 | $254,000 | $108,200 | $145,800 |
| 2017 | $4,994 | $254,000 | $108,200 | $145,800 |
| 2016 | $4,892 | $254,000 | $108,200 | $145,800 |
| 2015 | $4,778 | $254,000 | $108,200 | $145,800 |
| 2014 | $4,699 | $254,000 | $108,200 | $145,800 |
Property History
| Date | Event | Price | List to Sale | Price per Sq Ft |
|---|---|---|---|---|
| 11/17/2025 11/17/25 | For Sale | $799,900 | -- | $559 / Sq Ft |
Purchase History
| Date | Type | Sale Price | Title Company |
|---|---|---|---|
| Warranty Deed | $132,990 | -- |
Mortgage History
| Date | Status | Loan Amount | Loan Type |
|---|---|---|---|
| Open | $120,000 | No Value Available | |
| Closed | $131,340 | Unknown |
Source: SmartMLS
MLS Number: 24138282
APN: OSAY-000024-000081
Disclaimer: Certain information contained herein is derived from information provided by parties other than Homes.com. All information provided is deemed reliable, but is not guaranteed to be accurate and should be independently verified.
![]() IDX information is provided exclusively for personal, non-commercial use, and may not be used for any purpose other than to identify prospective properties consumers may be interested in purchasing. Information is deemed reliable but not guaranteed.
IDX information is provided exclusively for personal, non-commercial use, and may not be used for any purpose other than to identify prospective properties consumers may be interested in purchasing. Information is deemed reliable but not guaranteed.
- 10 Mulberry St
- 26 College St
- 4 Gibbons Cir
- 175 N Cove Rd
- 2 Old South Cove Rd
- 1 Lighthouse Ln
- 20 Saltus Dr
- 20 Hill St
- 23 Clinton Ave
- 6 South St
- 96 Fenwood Dr
- 355 Main St
- 100 Dudley Ave Unit D20
- 100 Dudley Ave Unit H43
- 33 Fenwood Rd
- 125 Main St
- 19 Lynde St
- 1333A Boston Post Rd
- 18 Quarry St
- 372 Maple Ave