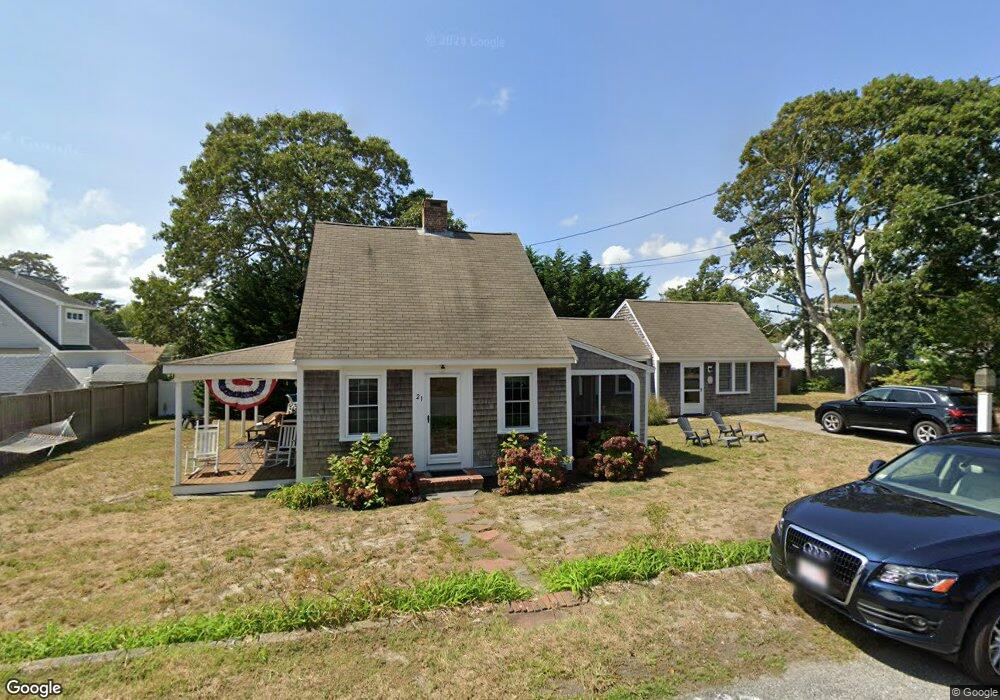
21 Ferncliff Rd Dennis Port, MA 02639
Dennis Port NeighborhoodEstimated Value: $787,000 - $931,000
3
Beds
4
Baths
1,836
Sq Ft
$469/Sq Ft
Est. Value
About This Home
This home is located at 21 Ferncliff Rd, Dennis Port, MA 02639 and is currently estimated at $860,672, approximately $468 per square foot. 21 Ferncliff Rd is a home located in Barnstable County with nearby schools including Dennis-Yarmouth Regional High School and St. Pius X. School.
Ownership History
Date
Name
Owned For
Owner Type
Purchase Details
Closed on
Sep 18, 2024
Sold by
Gaffney Susan
Bought by
Golden Rt Of 2024 and Gaffney
Current Estimated Value
Purchase Details
Closed on
Aug 13, 2024
Sold by
Golden Charles J and Golden Karen C
Bought by
Gaffney Susan
Purchase Details
Closed on
Dec 22, 1982
Bought by
Golden Charles J and Golden Karen C
Create a Home Valuation Report for This Property
The Home Valuation Report is an in-depth analysis detailing your home's value as well as a comparison with similar homes in the area
Home Values in the Area
Average Home Value in this Area
Purchase History
| Date | Buyer | Sale Price | Title Company |
|---|---|---|---|
| Golden Rt Of 2024 | -- | None Available | |
| Golden Rt Of 2024 | -- | None Available | |
| Gaffney Susan | -- | None Available | |
| Gaffney Susan | -- | None Available | |
| Golden Charles J | -- | -- |
Source: Public Records
Mortgage History
| Date | Status | Borrower | Loan Amount |
|---|---|---|---|
| Previous Owner | Golden Charles J | $40,000 |
Source: Public Records
Tax History Compared to Growth
Tax History
| Year | Tax Paid | Tax Assessment Tax Assessment Total Assessment is a certain percentage of the fair market value that is determined by local assessors to be the total taxable value of land and additions on the property. | Land | Improvement |
|---|---|---|---|---|
| 2025 | $3,342 | $771,800 | $296,300 | $475,500 |
| 2024 | $3,293 | $750,000 | $285,000 | $465,000 |
| 2023 | $3,184 | $681,900 | $259,000 | $422,900 |
| 2022 | $2,904 | $518,600 | $204,200 | $314,400 |
| 2021 | $2,710 | $449,400 | $200,200 | $249,200 |
| 2020 | $2,655 | $435,200 | $200,200 | $235,000 |
| 2019 | $2,605 | $422,200 | $213,100 | $209,100 |
| 2018 | $2,568 | $405,100 | $202,800 | $202,300 |
| 2017 | $2,337 | $380,000 | $186,800 | $193,200 |
| 2016 | $2,229 | $341,300 | $176,200 | $165,100 |
| 2015 | $2,184 | $341,300 | $176,200 | $165,100 |
| 2014 | $2,066 | $325,300 | $165,500 | $159,800 |
Source: Public Records
Map
Nearby Homes
- 22 Ferncliff Rd
- 102 Sea St
- 37-A Beach Hills Rd
- 37 Beach Hills Rd
- 262 Old Wharf Rd Unit 67
- 262 Old Wharf Rd Unit 5
- 262 Old Wharf Rd Unit 5
- 262 Old Wharf Rd Unit 20
- 262 Old Wharf Rd Unit 87
- 402 Old Wharf Rd
- 402 Old Wharf Rd
- 405 Old Wharf Rd Unit B204
- 405 Old Wharf Rd Unit B204
- 241 Old Wharf Rd Unit 82
- 241 Old Wharf Rd Unit 127
- 241 Old Wharf Rd Unit 90
- 31 Easy St
- 11 Ocean Park W
- 9 Chase Ave Unit 6
- 217 Old Wharf Rd Unit 64