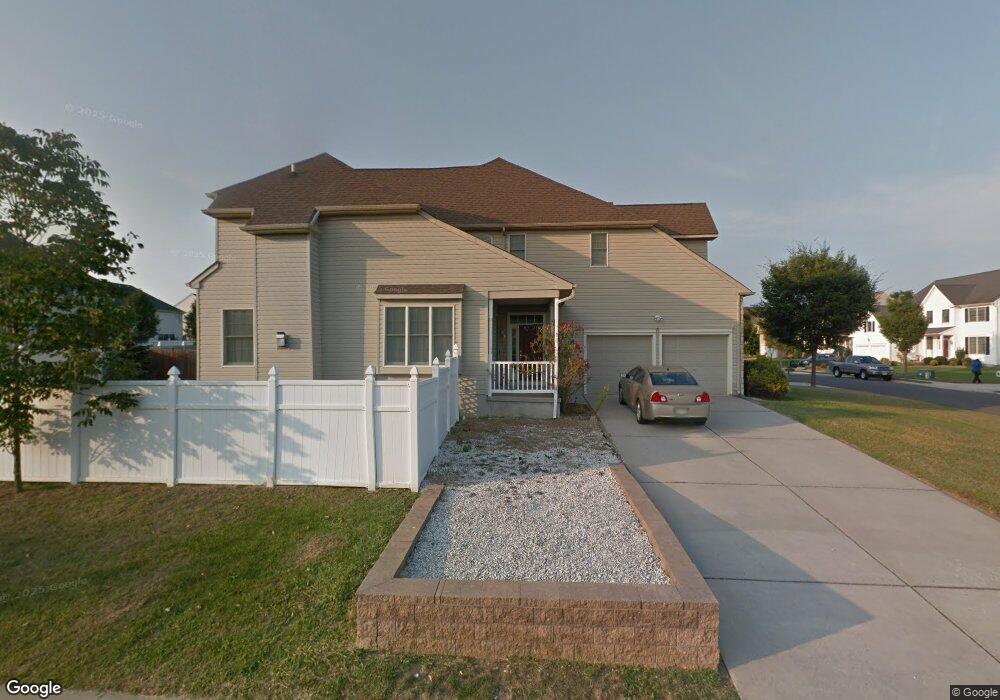
21 Fieldcrest Dr Columbus, NJ 08022
Estimated Value: $476,000 - $627,000
Studio
--
Bath
2,226
Sq Ft
$249/Sq Ft
Est. Value
About This Home
This home is located at 21 Fieldcrest Dr, Columbus, NJ 08022 and is currently estimated at $554,628, approximately $249 per square foot. 21 Fieldcrest Dr is a home located in Burlington County with nearby schools including John Hydock Elementary School, Mansfield Township Elementary School, and Northern Burlington County Regional Middle School.
Ownership History
Date
Name
Owned For
Owner Type
Purchase Details
Closed on
Dec 19, 2012
Sold by
Santivansky Randy and Santivansky Lori H
Bought by
Santivansky Lori H and Santivansky Randy
Current Estimated Value
Home Financials for this Owner
Home Financials are based on the most recent Mortgage that was taken out on this home.
Original Mortgage
$197,250
Outstanding Balance
$87,084
Interest Rate
3.35%
Mortgage Type
New Conventional
Estimated Equity
$467,544
Purchase Details
Closed on
Jul 10, 2003
Sold by
Generation Builders Inc
Bought by
Santivansky Randy and Engelhardt Lori
Home Financials for this Owner
Home Financials are based on the most recent Mortgage that was taken out on this home.
Original Mortgage
$234,810
Interest Rate
5.28%
Mortgage Type
Purchase Money Mortgage
Purchase Details
Closed on
Jun 10, 2003
Sold by
Homestead At Mansfield Inc
Bought by
Generation Builders Inc
Home Financials for this Owner
Home Financials are based on the most recent Mortgage that was taken out on this home.
Original Mortgage
$234,810
Interest Rate
5.28%
Mortgage Type
Purchase Money Mortgage
Create a Home Valuation Report for This Property
The Home Valuation Report is an in-depth analysis detailing your home's value as well as a comparison with similar homes in the area
Home Values in the Area
Average Home Value in this Area
Purchase History
| Date | Buyer | Sale Price | Title Company |
|---|---|---|---|
| Santivansky Lori H | -- | Accurate Title Group | |
| Santivansky Randy | $260,900 | -- | |
| Generation Builders Inc | $60,000 | -- |
Source: Public Records
Mortgage History
| Date | Status | Borrower | Loan Amount |
|---|---|---|---|
| Open | Santivansky Lori H | $197,250 | |
| Closed | Santivansky Randy | $234,810 | |
| Previous Owner | Generation Builders Inc | $234,810 |
Source: Public Records
Tax History
| Year | Tax Paid | Tax Assessment Tax Assessment Total Assessment is a certain percentage of the fair market value that is determined by local assessors to be the total taxable value of land and additions on the property. | Land | Improvement |
|---|---|---|---|---|
| 2025 | $9,751 | $300,500 | $99,000 | $201,500 |
| 2024 | $9,820 | $300,500 | $99,000 | $201,500 |
| 2023 | $9,820 | $300,500 | $99,000 | $201,500 |
| 2022 | $9,920 | $300,500 | $99,000 | $201,500 |
| 2021 | $9,250 | $300,500 | $99,000 | $201,500 |
| 2020 | $10,019 | $300,500 | $99,000 | $201,500 |
| 2019 | $9,772 | $300,500 | $99,000 | $201,500 |
| 2018 | $9,370 | $300,500 | $99,000 | $201,500 |
| 2017 | $9,114 | $300,500 | $99,000 | $201,500 |
| 2016 | $9,120 | $300,500 | $99,000 | $201,500 |
| 2015 | $6,292 | $212,000 | $99,000 | $113,000 |
| 2014 | $6,021 | $212,000 | $99,000 | $113,000 |
Source: Public Records
Map
Nearby Homes
- 306 Hilltop Ln E
- 225 Wagon Wheel Ln
- 243 Wagon Wheel Ln
- 213 Homestead Cir
- 206 Wagon Wheel Ln
- 316 Wagon Wheel Cir
- 3 Deep Hollow Ln N
- 12 Windmill Ct
- 87 Horseshoe Ln S
- 11 Covered Bridge Cir
- 117 Carriage Hill Ct
- 14 Covered Bridge Cir
- 3 Covered Bridge Ln
- 2 Fernwood Ct
- 102 Carriage Hill Ct
- 23 Fernwood Ct
- 24381 W Main St
- 350 New York Ave
- 1200 New York Ave
- 85 Cedar Lane Extension
- 3 Heather Ct
- 2 Summerhill Ct
- 23 Fieldcrest Dr
- 4 Heather Ct
- 5 Heather Ct
- 19 Fieldcrest Dr
- 6 Heather Ct
- 20 Fieldcrest Dr
- 7 Heather Ct
- 17 Fieldcrest Dr
- 4 Summerhill Ct
- 3 Summerhill Ct
- 8 Heather Ct
- 6 Summerhill Ct
- 15 Fieldcrest Dr
- 18 Fieldcrest Dr
- 9 Heather Ct
- 1 Cobblestone Ct
- 2 Gardengate Ct
- 5 Summerhill Ct
Your Personal Tour Guide
Ask me questions while you tour the home.