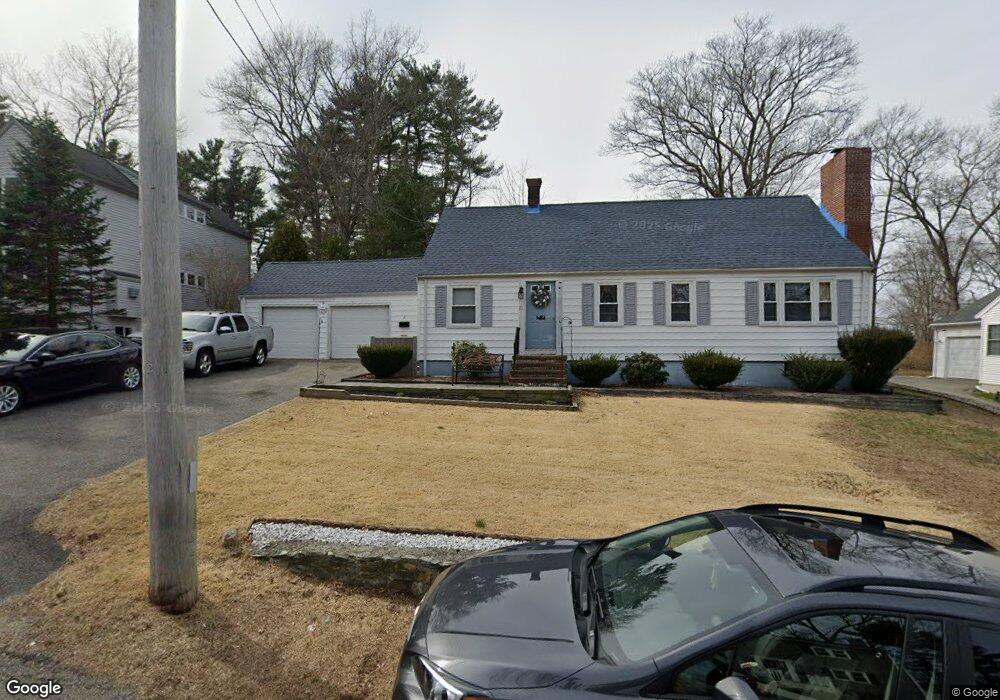
21 Fisher Rd South Weymouth, MA 02190
South Weymouth NeighborhoodEstimated Value: $658,000 - $788,000
2
Beds
2
Baths
1,548
Sq Ft
$447/Sq Ft
Est. Value
About This Home
This home is located at 21 Fisher Rd, South Weymouth, MA 02190 and is currently estimated at $692,609, approximately $447 per square foot. 21 Fisher Rd is a home located in Norfolk County with nearby schools including Thomas V Nash, Abigail Adams Middle School, and Weymouth Middle School Chapman.
Ownership History
Date
Name
Owned For
Owner Type
Purchase Details
Closed on
Dec 20, 1993
Sold by
Sheridan Dianne M
Bought by
Stanley Wayne M and Stanley Ann M
Current Estimated Value
Home Financials for this Owner
Home Financials are based on the most recent Mortgage that was taken out on this home.
Original Mortgage
$125,000
Interest Rate
7.03%
Mortgage Type
Purchase Money Mortgage
Purchase Details
Closed on
Aug 1, 1988
Sold by
Cmv Trust
Bought by
Caldwell Robert D
Home Financials for this Owner
Home Financials are based on the most recent Mortgage that was taken out on this home.
Original Mortgage
$135,900
Interest Rate
10.39%
Mortgage Type
Purchase Money Mortgage
Create a Home Valuation Report for This Property
The Home Valuation Report is an in-depth analysis detailing your home's value as well as a comparison with similar homes in the area
Home Values in the Area
Average Home Value in this Area
Purchase History
| Date | Buyer | Sale Price | Title Company |
|---|---|---|---|
| Stanley Wayne M | $160,000 | -- | |
| Caldwell Robert D | $169,900 | -- |
Source: Public Records
Mortgage History
| Date | Status | Borrower | Loan Amount |
|---|---|---|---|
| Open | Caldwell Robert D | $261,842 | |
| Closed | Caldwell Robert D | $125,000 | |
| Previous Owner | Caldwell Robert D | $135,900 |
Source: Public Records
Tax History Compared to Growth
Tax History
| Year | Tax Paid | Tax Assessment Tax Assessment Total Assessment is a certain percentage of the fair market value that is determined by local assessors to be the total taxable value of land and additions on the property. | Land | Improvement |
|---|---|---|---|---|
| 2025 | $5,496 | $544,200 | $221,800 | $322,400 |
| 2024 | $5,324 | $518,400 | $211,200 | $307,200 |
| 2023 | $5,547 | $530,800 | $213,400 | $317,400 |
| 2022 | $5,403 | $471,500 | $197,600 | $273,900 |
| 2021 | $5,174 | $440,700 | $197,600 | $243,100 |
| 2020 | $5,037 | $422,600 | $197,600 | $225,000 |
| 2019 | $4,913 | $405,400 | $190,000 | $215,400 |
| 2018 | $4,758 | $380,600 | $180,900 | $199,700 |
| 2017 | $4,723 | $368,700 | $172,300 | $196,400 |
| 2016 | $4,539 | $354,600 | $165,700 | $188,900 |
| 2015 | $4,356 | $337,700 | $165,700 | $172,000 |
| 2014 | $4,010 | $301,500 | $147,800 | $153,700 |
Source: Public Records
Map
Nearby Homes
- 16 Jay Rd
- 24 Fisher Rd
- 308 Forest St
- 68 Massapoag St Unit 7
- 92 Mercury St
- 262 West St
- 255 West St
- 354 Tilden Commons Ln
- 193 Randolph St
- 211 Randolph St
- 120 Randolph St
- 655 Summer St
- 134 Tyson Commons Ln
- 2 Mitchell Ln Unit B
- 175 Tyson Commons Ln
- 30 Bradford Commons Ln
- 27 Park Ave
- 50 Hollis St
- 441 Grove St
- 432 Grove St