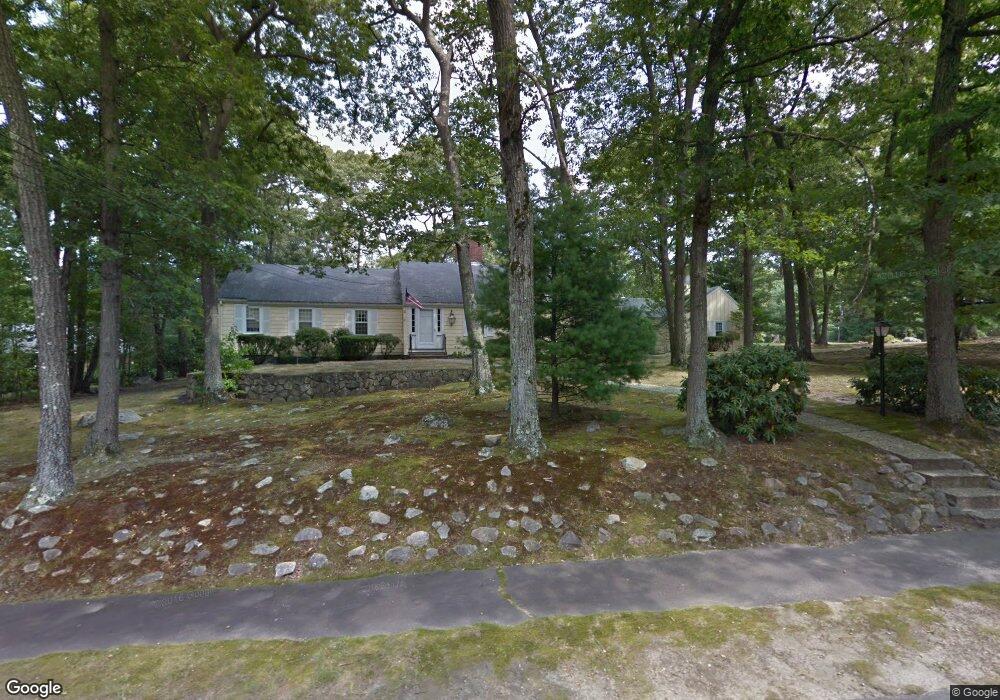
21 Fletcher Rd Unit 21 Lynnfield, MA 01940
Estimated Value: $1,086,205 - $1,297,000
4
Beds
3
Baths
3,310
Sq Ft
$372/Sq Ft
Est. Value
About This Home
This home is located at 21 Fletcher Rd Unit 21, Lynnfield, MA 01940 and is currently estimated at $1,231,051, approximately $371 per square foot. 21 Fletcher Rd Unit 21 is a home located in Essex County with nearby schools including Lynnfield Middle School, Pickering Middle School, and Lynnfield High School.
Ownership History
Date
Name
Owned For
Owner Type
Purchase Details
Closed on
Oct 28, 2014
Sold by
Adinolfi Josephine C E and Adinolfi A
Bought by
Carroll Rachel M and Polansky Jared J
Current Estimated Value
Purchase Details
Closed on
Jan 28, 2008
Sold by
Adinolfi P Arthur and Adinolfi Paul A
Bought by
Adinolfi Josephine C
Purchase Details
Closed on
Jan 24, 2008
Sold by
Adinolfi Josephine C and Adinolfi Arthur P
Bought by
Adinolfi Josephine C
Create a Home Valuation Report for This Property
The Home Valuation Report is an in-depth analysis detailing your home's value as well as a comparison with similar homes in the area
Home Values in the Area
Average Home Value in this Area
Purchase History
| Date | Buyer | Sale Price | Title Company |
|---|---|---|---|
| Carroll Rachel M | $555,000 | -- | |
| Carroll Rachel M | $555,000 | -- | |
| Adinolfi Josephine C | -- | -- | |
| Adinolfi Josephine C | -- | -- | |
| Adinolfi Josephine C | -- | -- | |
| Adinolfi Josephine C | -- | -- | |
| Adinolfi Josephine C | -- | -- |
Source: Public Records
Mortgage History
| Date | Status | Borrower | Loan Amount |
|---|---|---|---|
| Previous Owner | Adinolfi Josephine C | $25,000 | |
| Closed | Carroll Rachel M | $0 |
Source: Public Records
Tax History Compared to Growth
Tax History
| Year | Tax Paid | Tax Assessment Tax Assessment Total Assessment is a certain percentage of the fair market value that is determined by local assessors to be the total taxable value of land and additions on the property. | Land | Improvement |
|---|---|---|---|---|
| 2025 | $10,633 | $1,006,900 | $636,700 | $370,200 |
| 2024 | $10,180 | $968,600 | $612,200 | $356,400 |
| 2023 | $10,277 | $909,500 | $580,600 | $328,900 |
| 2022 | $9,815 | $818,600 | $533,200 | $285,400 |
| 2021 | $9,379 | $706,800 | $434,500 | $272,300 |
| 2020 | $9,209 | $661,600 | $389,100 | $272,500 |
| 2019 | $9,203 | $661,600 | $389,100 | $272,500 |
| 2018 | $8,918 | $648,100 | $389,100 | $259,000 |
| 2017 | $8,741 | $634,300 | $375,300 | $259,000 |
| 2016 | $8,233 | $567,800 | $322,000 | $245,800 |
| 2015 | -- | $555,700 | $320,800 | $234,900 |
Source: Public Records
Map
Nearby Homes