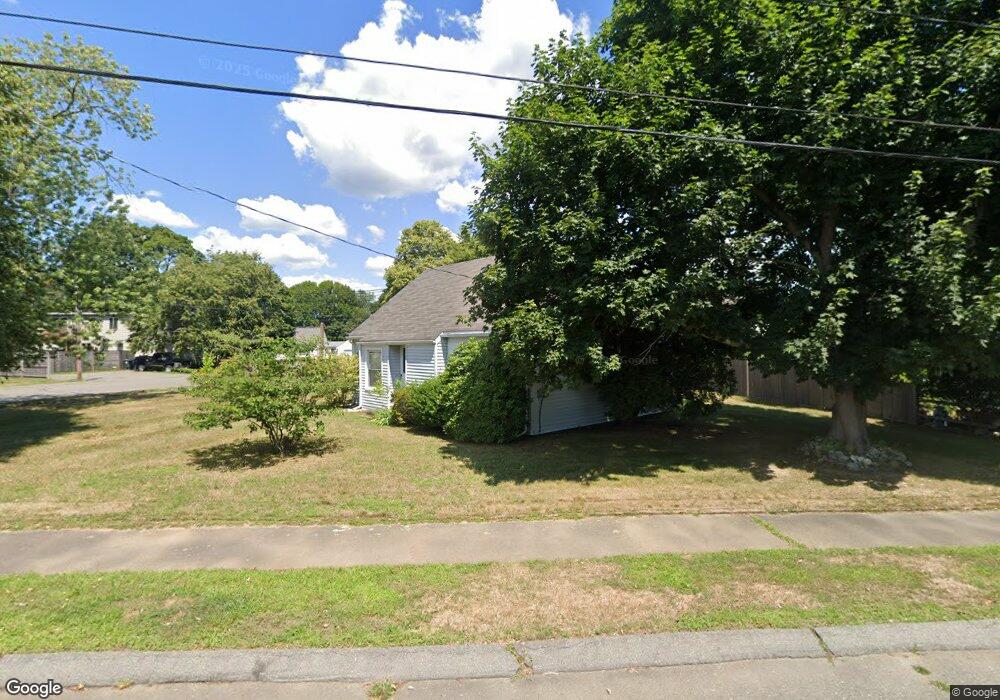
21 Flint St Danvers, MA 01923
Estimated Value: $640,610 - $909,000
4
Beds
2
Baths
1,706
Sq Ft
$431/Sq Ft
Est. Value
About This Home
This home is located at 21 Flint St, Danvers, MA 01923 and is currently estimated at $734,653, approximately $430 per square foot. 21 Flint St is a home located in Essex County with nearby schools including Danvers High School, St. Mary of the Annunciation School, and Plumfield Academy.
Ownership History
Date
Name
Owned For
Owner Type
Purchase Details
Closed on
Jan 11, 2010
Sold by
Repucci Eleanor F
Bought by
Repucci Susan C
Current Estimated Value
Purchase Details
Closed on
Jun 25, 2009
Sold by
21 Flint St T
Bought by
Repucci Eleanor F
Purchase Details
Closed on
Apr 2, 2009
Sold by
Repucci Eleanor F
Bought by
21 Flint Street T
Create a Home Valuation Report for This Property
The Home Valuation Report is an in-depth analysis detailing your home's value as well as a comparison with similar homes in the area
Home Values in the Area
Average Home Value in this Area
Purchase History
| Date | Buyer | Sale Price | Title Company |
|---|---|---|---|
| Repucci Susan C | -- | -- | |
| Repucci Eleanor F | -- | -- | |
| 21 Flint Street T | -- | -- | |
| Repucci Eleanor F | -- | -- | |
| Repucci Ft | -- | -- |
Source: Public Records
Tax History
| Year | Tax Paid | Tax Assessment Tax Assessment Total Assessment is a certain percentage of the fair market value that is determined by local assessors to be the total taxable value of land and additions on the property. | Land | Improvement |
|---|---|---|---|---|
| 2025 | $6,083 | $553,500 | $338,300 | $215,200 |
| 2024 | $6,022 | $542,000 | $338,300 | $203,700 |
| 2023 | $5,769 | $491,000 | $307,500 | $183,500 |
| 2022 | $5,754 | $454,500 | $279,000 | $175,500 |
| 2021 | $5,551 | $415,800 | $264,300 | $151,500 |
| 2020 | $5,386 | $412,400 | $261,200 | $151,200 |
| 2019 | $5,126 | $386,000 | $237,400 | $148,600 |
| 2018 | $5,000 | $369,300 | $235,100 | $134,200 |
| 2017 | $4,705 | $331,600 | $205,400 | $126,200 |
| 2016 | $4,517 | $318,100 | $195,900 | $122,200 |
| 2015 | $4,352 | $291,900 | $178,100 | $113,800 |
Source: Public Records
Map
Nearby Homes
- 97 Sylvan St Unit 7
- 57 Adams St
- 63 Adams St
- 11 Andover St
- 22 Collins St Unit 31
- 10 Clark St
- 14 Williams St Unit C17
- 152 Endicott St
- 5 Holten St
- 108 Abington Rd Unit 108
- 43 Hobart St Unit B
- 35 High St Unit 3D
- 6 Venice St Unit B3
- 22 Maple Ave
- 11 Riverside Ave Unit 111
- 34 Bayview Terrace Unit 5
- 147 High St
- 35 Locust St Unit 3
- 102 Centre St
- 7 Riverbank Ave Unit 7
Your Personal Tour Guide
Ask me questions while you tour the home.