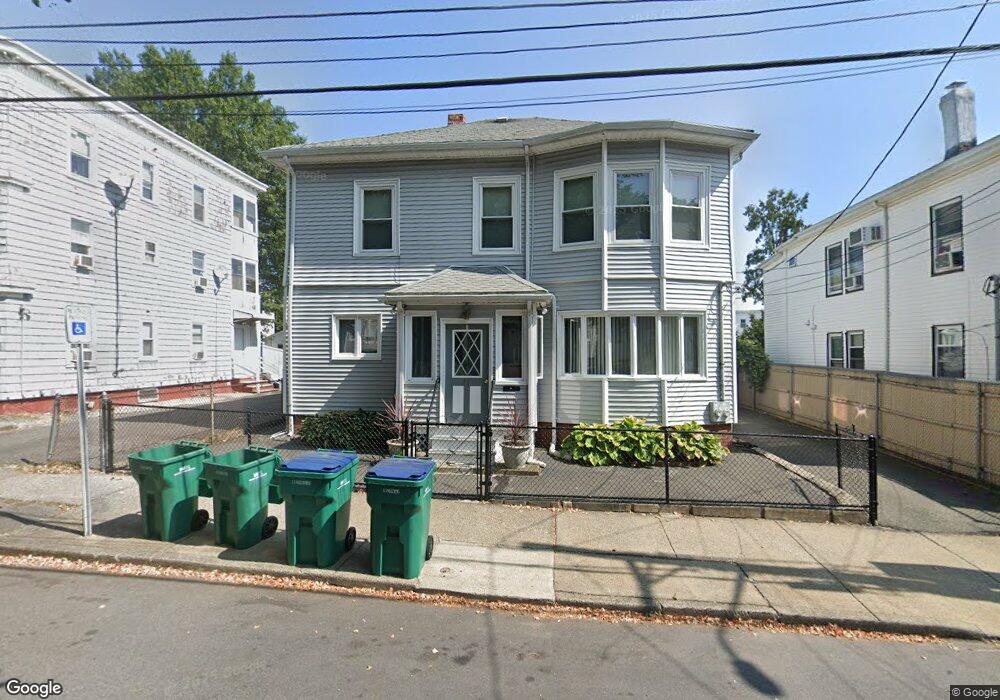
21 Flint St Lynn, MA 01905
Lower Boston Street NeighborhoodEstimated Value: $791,806 - $1,006,000
6
Beds
2
Baths
3,064
Sq Ft
$286/Sq Ft
Est. Value
About This Home
This home is located at 21 Flint St, Lynn, MA 01905 and is currently estimated at $876,702, approximately $286 per square foot. 21 Flint St is a home located in Essex County with nearby schools including William R. Fallon School, Lincoln-Thomson Elementary School, and Breed Middle School.
Ownership History
Date
Name
Owned For
Owner Type
Purchase Details
Closed on
Jun 9, 2016
Sold by
Landry Diane L and Landry David R
Bought by
Landry Diane L and Landry David R
Current Estimated Value
Purchase Details
Closed on
May 12, 2016
Sold by
Gigas Rose A and Landry Diane L
Bought by
Landry Diane L and Landry David R
Purchase Details
Closed on
Mar 7, 2014
Sold by
Gigas James P and Gigas Rose A
Bought by
Gigas Rose A
Purchase Details
Closed on
Jan 1, 1965
Bought by
Gigas Rose A and Landry Diane L
Create a Home Valuation Report for This Property
The Home Valuation Report is an in-depth analysis detailing your home's value as well as a comparison with similar homes in the area
Home Values in the Area
Average Home Value in this Area
Purchase History
| Date | Buyer | Sale Price | Title Company |
|---|---|---|---|
| Landry Diane L | -- | -- | |
| Landry Diane L | -- | -- | |
| Landry Diane L | -- | -- | |
| Landry Diane L | -- | -- | |
| Gigas Rose A | -- | -- | |
| Gigas Rose A | -- | -- | |
| Gigas Rose A | -- | -- |
Source: Public Records
Tax History
| Year | Tax Paid | Tax Assessment Tax Assessment Total Assessment is a certain percentage of the fair market value that is determined by local assessors to be the total taxable value of land and additions on the property. | Land | Improvement |
|---|---|---|---|---|
| 2025 | $8,223 | $793,705 | $218,100 | $575,605 |
| 2024 | $7,598 | $721,600 | $191,600 | $530,000 |
| 2023 | $7,698 | $690,400 | $197,900 | $492,500 |
| 2022 | $7,492 | $602,700 | $146,500 | $456,200 |
| 2021 | $7,043 | $540,500 | $134,700 | $405,800 |
| 2020 | $6,569 | $490,200 | $129,700 | $360,500 |
| 2019 | $6,365 | $445,100 | $122,100 | $323,000 |
| 2018 | $6,154 | $406,200 | $134,700 | $271,500 |
| 2017 | $6,232 | $399,500 | $112,000 | $287,500 |
| 2016 | $5,789 | $357,800 | $104,900 | $252,900 |
| 2015 | $5,484 | $327,400 | $104,000 | $223,400 |
Source: Public Records
Map
Nearby Homes
- 73 Waterhill St
- 46 Wilfred St
- 590 Boston St Unit 303
- 70 Wyman St
- 78-80 Spencer St
- 20 Murray St
- 50-50A Kirtland St
- 45 Cottage St Unit 3
- 79 Laurel St
- 268 Walnut St
- 6 Morris St
- 34 Grove St
- 76-78 Linden St
- 16 Salem St
- 11 Margin St Unit 7
- 24 Hathaway St
- 32 Birch Brook Landing Unit 23
- 32 Birch Brook Landing Unit 25
- 32 Birch Brook Landing Unit 22
- 32 Birch Brook Rd Unit 13
Your Personal Tour Guide
Ask me questions while you tour the home.