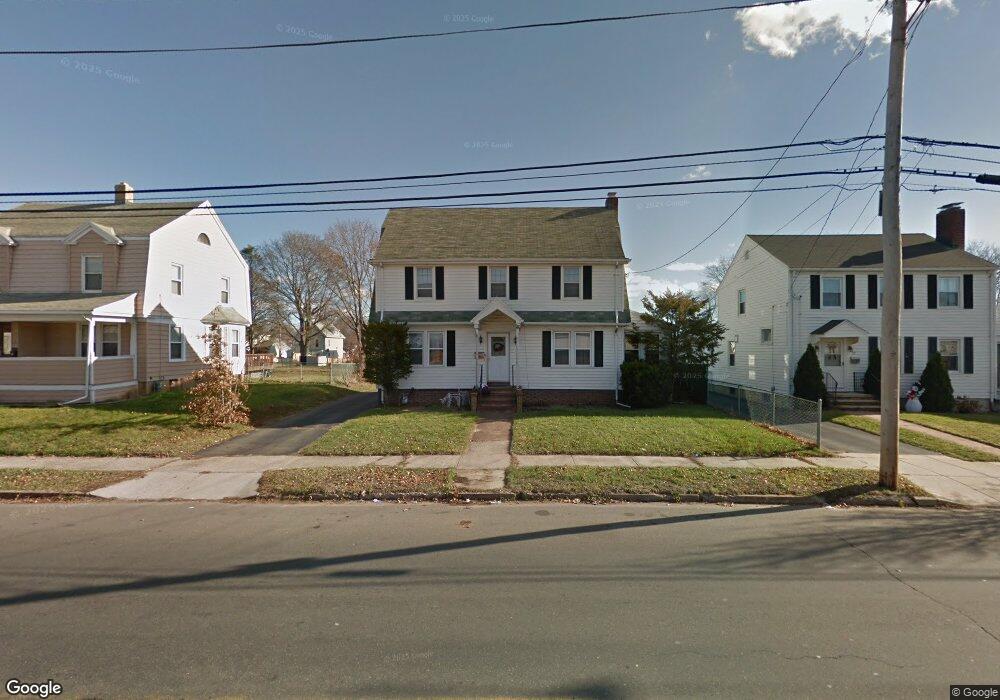
21 Forbes Place East Haven, CT 06512
Estimated Value: $326,000 - $531,000
3
Beds
2
Baths
1,977
Sq Ft
$216/Sq Ft
Est. Value
About This Home
This home is located at 21 Forbes Place, East Haven, CT 06512 and is currently estimated at $426,631, approximately $215 per square foot. 21 Forbes Place is a home located in New Haven County with nearby schools including East Haven High School, Cold Spring School, and Pathway School.
Ownership History
Date
Name
Owned For
Owner Type
Purchase Details
Closed on
Sep 23, 2009
Sold by
Defelice Marie
Bought by
Gary Susan N and Murphy Alexander B
Current Estimated Value
Home Financials for this Owner
Home Financials are based on the most recent Mortgage that was taken out on this home.
Original Mortgage
$188,000
Outstanding Balance
$123,699
Interest Rate
5.31%
Estimated Equity
$302,932
Create a Home Valuation Report for This Property
The Home Valuation Report is an in-depth analysis detailing your home's value as well as a comparison with similar homes in the area
Home Values in the Area
Average Home Value in this Area
Purchase History
| Date | Buyer | Sale Price | Title Company |
|---|---|---|---|
| Gary Susan N | $39,166 | -- | |
| Gary Susan N | $19,583 | -- | |
| Gary Susan N | $19,583 | -- | |
| Gary Susan N | $156,666 | -- |
Source: Public Records
Mortgage History
| Date | Status | Borrower | Loan Amount |
|---|---|---|---|
| Open | Gary Susan N | $188,000 | |
| Previous Owner | Gary Susan N | $15,000 |
Source: Public Records
Tax History Compared to Growth
Tax History
| Year | Tax Paid | Tax Assessment Tax Assessment Total Assessment is a certain percentage of the fair market value that is determined by local assessors to be the total taxable value of land and additions on the property. | Land | Improvement |
|---|---|---|---|---|
| 2025 | $5,939 | $177,590 | $48,020 | $129,570 |
| 2024 | $5,939 | $177,590 | $48,020 | $129,570 |
| 2023 | $5,541 | $177,590 | $48,020 | $129,570 |
| 2022 | $5,541 | $177,590 | $48,020 | $129,570 |
| 2021 | $4,832 | $141,080 | $45,910 | $95,170 |
| 2020 | $4,832 | $141,080 | $45,910 | $95,170 |
| 2019 | $4,574 | $141,080 | $45,910 | $95,170 |
| 2018 | $4,578 | $141,080 | $45,910 | $95,170 |
| 2017 | $4,451 | $141,080 | $45,910 | $95,170 |
| 2016 | $4,605 | $145,950 | $45,910 | $100,040 |
| 2015 | $4,605 | $145,950 | $45,910 | $100,040 |
| 2014 | $4,678 | $145,950 | $45,910 | $100,040 |
Source: Public Records
Map
Nearby Homes
- 17 Guilford Ct
- 364 Main St Unit 47
- 71 High St
- 47 Guilford Ct
- 93 Kimberly Ave
- 20 Weber St
- 14 Gerrish Ave
- 237 N High St
- 458 Thompson Ave
- 133 Charter Oak Ave
- 103 Saltonstall Pkwy
- 31 Forest St
- 34 Hughes St
- 18 Lenox St
- 50 Robert Dr
- 300 Bradley St
- 4 Laura Ln
- 34 River St
- 120 Harrington Ave
- 66 Elizabeth Ann Dr