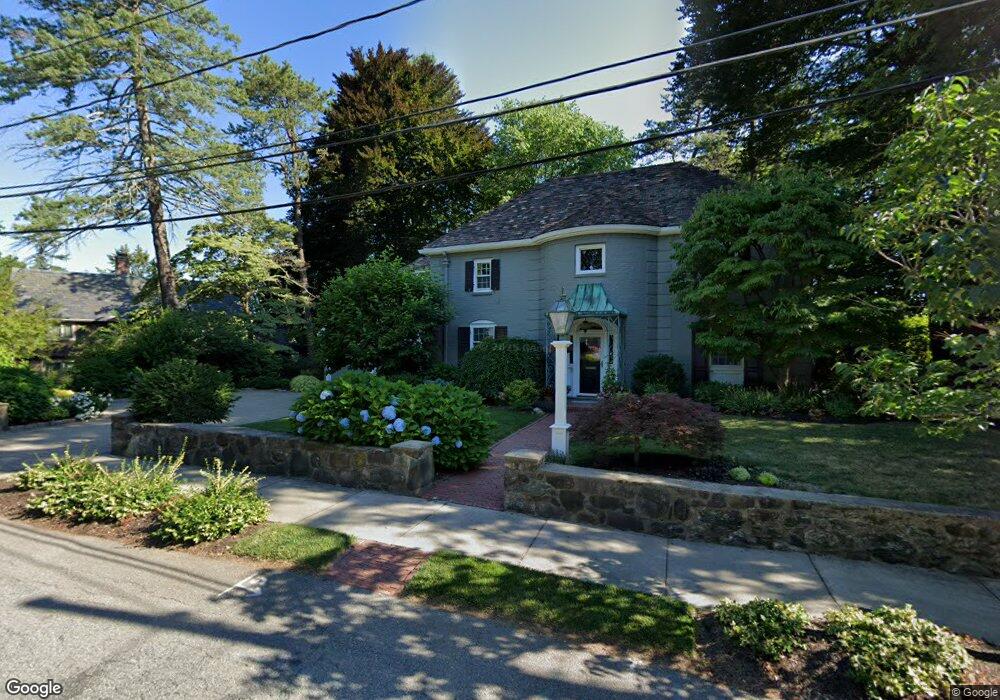
21 Fox Ln Newton Center, MA 02459
Oak Hill NeighborhoodEstimated Value: $2,172,000 - $2,406,000
4
Beds
3
Baths
3,529
Sq Ft
$645/Sq Ft
Est. Value
About This Home
This home is located at 21 Fox Ln, Newton Center, MA 02459 and is currently estimated at $2,277,348, approximately $645 per square foot. 21 Fox Ln is a home located in Middlesex County with nearby schools including Countryside Elementary School, Memorial Spaulding Elementary School, and Charles E Brown Middle School.
Ownership History
Date
Name
Owned For
Owner Type
Purchase Details
Closed on
Sep 15, 2010
Sold by
Zapson Daniel S and Zapson Jill S
Bought by
Vogel Alex J and Cohen Anita H
Current Estimated Value
Home Financials for this Owner
Home Financials are based on the most recent Mortgage that was taken out on this home.
Original Mortgage
$754,000
Outstanding Balance
$499,656
Interest Rate
4.51%
Mortgage Type
Purchase Money Mortgage
Estimated Equity
$1,777,692
Purchase Details
Closed on
Oct 31, 2003
Sold by
Hurwitz Judith R
Bought by
Zapson Jill S and Zapson Daniel S
Home Financials for this Owner
Home Financials are based on the most recent Mortgage that was taken out on this home.
Original Mortgage
$712,000
Interest Rate
6.05%
Mortgage Type
Purchase Money Mortgage
Create a Home Valuation Report for This Property
The Home Valuation Report is an in-depth analysis detailing your home's value as well as a comparison with similar homes in the area
Home Values in the Area
Average Home Value in this Area
Purchase History
| Date | Buyer | Sale Price | Title Company |
|---|---|---|---|
| Vogel Alex J | $1,160,000 | -- | |
| Zapson Jill S | $890,000 | -- |
Source: Public Records
Mortgage History
| Date | Status | Borrower | Loan Amount |
|---|---|---|---|
| Open | Vogel Alex J | $754,000 | |
| Previous Owner | Zapson Jill S | $712,000 |
Source: Public Records
Tax History Compared to Growth
Tax History
| Year | Tax Paid | Tax Assessment Tax Assessment Total Assessment is a certain percentage of the fair market value that is determined by local assessors to be the total taxable value of land and additions on the property. | Land | Improvement |
|---|---|---|---|---|
| 2025 | $18,930 | $1,931,600 | $1,063,500 | $868,100 |
| 2024 | $18,303 | $1,875,300 | $1,032,500 | $842,800 |
| 2023 | $17,759 | $1,744,500 | $798,200 | $946,300 |
| 2022 | $16,993 | $1,615,300 | $739,100 | $876,200 |
| 2021 | $16,397 | $1,523,900 | $697,300 | $826,600 |
| 2020 | $15,910 | $1,523,900 | $697,300 | $826,600 |
| 2019 | $15,461 | $1,479,500 | $677,000 | $802,500 |
| 2018 | $15,021 | $1,388,300 | $621,300 | $767,000 |
| 2017 | $14,564 | $1,309,700 | $586,100 | $723,600 |
| 2016 | $13,929 | $1,224,000 | $547,800 | $676,200 |
| 2015 | $13,281 | $1,143,900 | $512,000 | $631,900 |
Source: Public Records
Map
Nearby Homes
- 58 Country Club Rd
- 65 Levbert Rd
- 41 Juniper Ln
- 135 Hartman Rd
- 415 Dedham St Unit D
- 45 Brandeis Rd
- 59 Deborah Rd
- 15 Buff Cir
- 56 Cynthia Rd
- 36 Cannon St
- 63 Drumlin Rd
- 36 Ober Rd
- 35 Haynes Rd
- 44 Lovett Rd
- 250 Woodcliff Rd
- 19 Selwyn Rd
- 21 Lovett Rd
- 99 Baldpate Hill Rd
- 207 Nahanton St Unit 207
- 454 Dudley Rd