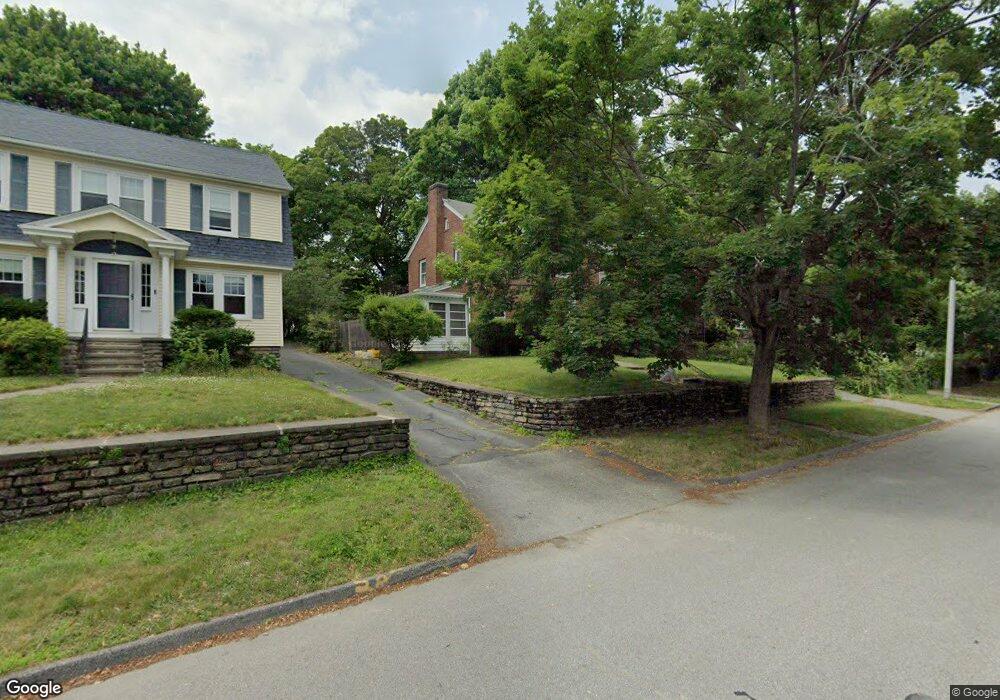
21 Frothingham Rd Worcester, MA 01605
Brittan Square NeighborhoodEstimated Value: $459,000 - $493,000
3
Beds
2
Baths
1,768
Sq Ft
$268/Sq Ft
Est. Value
About This Home
This home is located at 21 Frothingham Rd, Worcester, MA 01605 and is currently estimated at $473,884, approximately $268 per square foot. 21 Frothingham Rd is a home located in Worcester County with nearby schools including Jacob Hiatt Magnet School, Chandler Magnet, and Wawecus Road School.
Ownership History
Date
Name
Owned For
Owner Type
Purchase Details
Closed on
Sep 27, 2001
Sold by
Vanderheide Martin and Vanerheide Marci E
Bought by
Brown Steven H
Current Estimated Value
Home Financials for this Owner
Home Financials are based on the most recent Mortgage that was taken out on this home.
Original Mortgage
$189,905
Interest Rate
6.91%
Mortgage Type
Purchase Money Mortgage
Purchase Details
Closed on
Aug 4, 2000
Sold by
Braley William H and Giacopello Susan M
Bought by
Vanderheide Martin and Vanderheide Marci E
Purchase Details
Closed on
Jul 21, 1989
Sold by
Agerholm Paul
Bought by
Braley Wm H
Create a Home Valuation Report for This Property
The Home Valuation Report is an in-depth analysis detailing your home's value as well as a comparison with similar homes in the area
Home Values in the Area
Average Home Value in this Area
Purchase History
| Date | Buyer | Sale Price | Title Company |
|---|---|---|---|
| Brown Steven H | $199,900 | -- | |
| Vanderheide Martin | $172,900 | -- | |
| Braley Wm H | $155,000 | -- |
Source: Public Records
Mortgage History
| Date | Status | Borrower | Loan Amount |
|---|---|---|---|
| Open | Braley Wm H | $194,000 | |
| Closed | Braley Wm H | $26,500 | |
| Closed | Braley Wm H | $189,905 |
Source: Public Records
Tax History
| Year | Tax Paid | Tax Assessment Tax Assessment Total Assessment is a certain percentage of the fair market value that is determined by local assessors to be the total taxable value of land and additions on the property. | Land | Improvement |
|---|---|---|---|---|
| 2025 | $5,814 | $440,800 | $110,800 | $330,000 |
| 2024 | $5,686 | $413,500 | $110,800 | $302,700 |
| 2023 | $5,478 | $382,000 | $96,300 | $285,700 |
| 2022 | $5,077 | $333,800 | $77,100 | $256,700 |
| 2021 | $4,915 | $301,900 | $61,700 | $240,200 |
| 2020 | $4,760 | $280,000 | $61,700 | $218,300 |
| 2019 | $4,761 | $264,500 | $55,400 | $209,100 |
| 2018 | $4,729 | $250,100 | $55,400 | $194,700 |
| 2017 | $4,542 | $236,300 | $55,400 | $180,900 |
| 2016 | $4,575 | $222,000 | $41,500 | $180,500 |
| 2015 | $4,456 | $222,000 | $41,500 | $180,500 |
| 2014 | $4,338 | $222,000 | $41,500 | $180,500 |
Source: Public Records
Map
Nearby Homes
- 30 Melrose St
- 5 Wakefield St
- 2 Selden St
- 100 Burncoat St
- 25 Kenwood Ave
- 33 Denmark St
- 249 Lincoln St
- 6 Ashburnham Rd
- 27 Harlow St
- 78 Green Hill Pkwy
- 74 Green Hill Pkwy
- 176 Lincoln St Unit 4
- 32 Hemans St
- 26 Orne St
- 110 Beverly Rd
- 20B Edgeworth St
- 3 Perkins St
- 139 Lincoln St
- 63 North St Unit D
- 63 North St Unit C
- 19 Frothingham Rd
- 23 Frothingham Rd
- 17 Frothingham Rd
- 37 Burncoat St
- 0 Paper Birch Path Unit 62 72262325
- 0 Paper Birch Path Unit 45 72244855
- 0 Paper Birch Path Unit 46 72244853
- 0 Paper Birch Path Unit 57 72231862
- 0 Paper Birch Path Unit 21
- 0 Paper Birch Path Unit 22 72074380
- 39 Burncoat St
- 35 Burncoat St Unit 2
- 35 Burncoat St
- 35 Burncoat St Unit 1
- 16 Frothingham Rd
- 33 Burncoat St
- 33 Burncoat St Unit 2
- 20 Frothingham Rd
- 20 Frothingham Rd Unit 1
- 15 Frothingham Rd
Your Personal Tour Guide
Ask me questions while you tour the home.