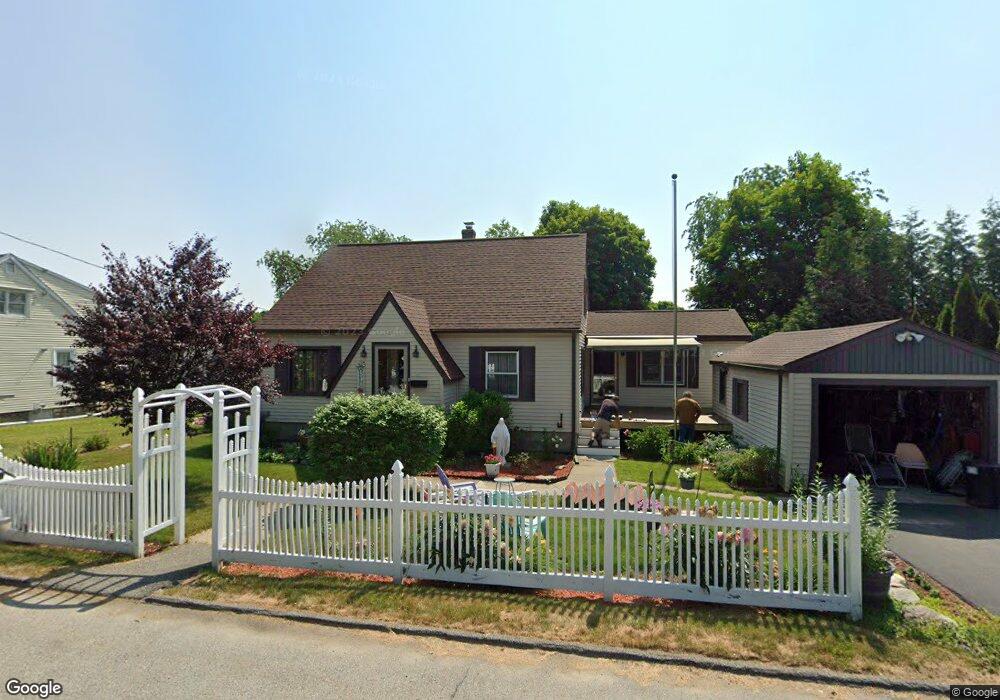
21 Gates Ct Auburn, MA 01501
Stoneville NeighborhoodEstimated Value: $460,000 - $478,000
3
Beds
3
Baths
1,614
Sq Ft
$290/Sq Ft
Est. Value
About This Home
This home is located at 21 Gates Ct, Auburn, MA 01501 and is currently estimated at $468,397, approximately $290 per square foot. 21 Gates Ct is a home located in Worcester County with nearby schools including Auburn Senior High School and Shrewsbury Montessori School - Auburn Campus.
Ownership History
Date
Name
Owned For
Owner Type
Purchase Details
Closed on
Mar 27, 2024
Sold by
Flynn Kevin C and Flynn Diane F
Bought by
Flynn Ft 2024 Irt and Leonard
Current Estimated Value
Purchase Details
Closed on
Nov 3, 1981
Bought by
Flynn Kevin C
Create a Home Valuation Report for This Property
The Home Valuation Report is an in-depth analysis detailing your home's value as well as a comparison with similar homes in the area
Home Values in the Area
Average Home Value in this Area
Purchase History
| Date | Buyer | Sale Price | Title Company |
|---|---|---|---|
| Flynn Ft 2024 Irt | -- | None Available | |
| Flynn Kevin C | $41,000 | -- |
Source: Public Records
Mortgage History
| Date | Status | Borrower | Loan Amount |
|---|---|---|---|
| Previous Owner | Flynn Kevin C | $127,000 | |
| Previous Owner | Flynn Kevin C | $51,000 | |
| Previous Owner | Flynn Kevin C | $50,000 |
Source: Public Records
Tax History
| Year | Tax Paid | Tax Assessment Tax Assessment Total Assessment is a certain percentage of the fair market value that is determined by local assessors to be the total taxable value of land and additions on the property. | Land | Improvement |
|---|---|---|---|---|
| 2025 | $59 | $412,200 | $123,800 | $288,400 |
| 2024 | $5,641 | $377,800 | $117,300 | $260,500 |
| 2023 | $5,563 | $350,300 | $106,600 | $243,700 |
| 2022 | $5,211 | $309,800 | $106,600 | $203,200 |
| 2021 | $2,673 | $277,000 | $94,100 | $182,900 |
| 2020 | $4,853 | $269,900 | $94,100 | $175,800 |
| 2019 | $3,867 | $261,200 | $93,100 | $168,100 |
| 2018 | $6,402 | $251,500 | $87,100 | $164,400 |
| 2017 | $2,485 | $240,700 | $79,000 | $161,700 |
| 2016 | $5,738 | $232,000 | $82,300 | $149,700 |
| 2015 | $3,901 | $226,000 | $82,300 | $143,700 |
| 2014 | $3,788 | $219,100 | $78,400 | $140,700 |
Source: Public Records
Map
Nearby Homes
- 177 Boyce St
- 18 Carroll St
- 5 Commonwealth Ave
- 25 Vinal St Unit 28
- 25 Vinal St Unit 26
- 25 Vinal St Unit 29
- 25 Vinal St Unit 30
- 61 Sumner St
- 177 Oxford St N
- 19-20 Williams St
- 88 Shore Dr
- 1-9 Helens Way
- 10 Hulbert Rd Unit 10
- 33 Eastford Rd
- 12 Bylund Ave
- 103 Henshaw St
- 84 Eureka St
- 401 Forest Park Dr
- 5 Clarendon Rd
- 328 Oxford St N
Your Personal Tour Guide
Ask me questions while you tour the home.