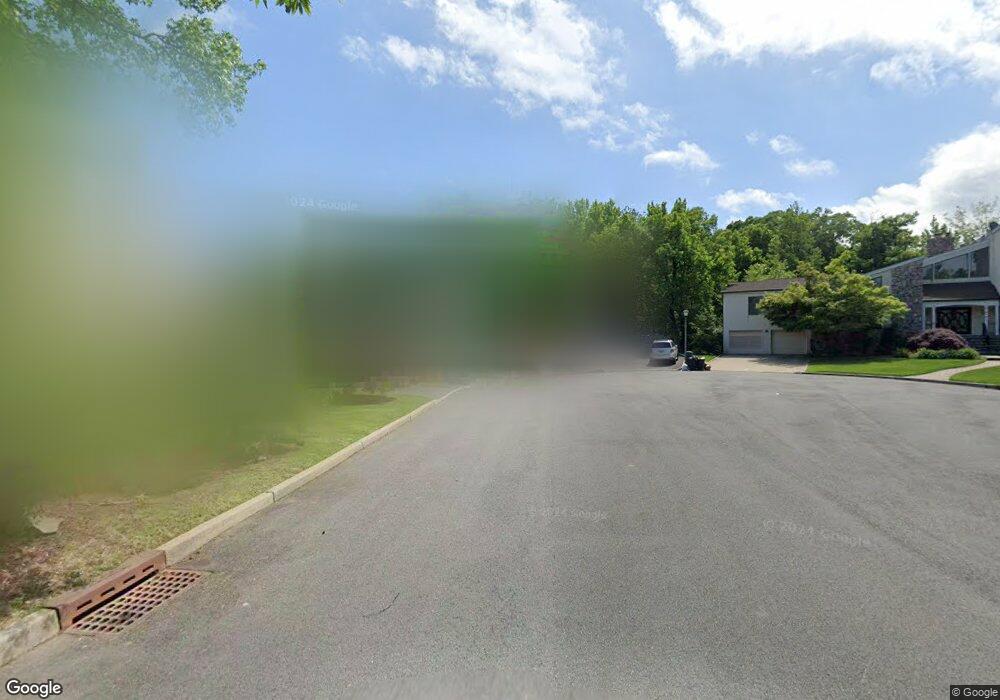
21 Geraldine Ct Englewood Cliffs, NJ 07632
Estimated Value: $1,903,693 - $2,971,000
--
Bed
--
Bath
3,724
Sq Ft
$620/Sq Ft
Est. Value
About This Home
This home is located at 21 Geraldine Ct, Englewood Cliffs, NJ 07632 and is currently estimated at $2,309,673, approximately $620 per square foot. 21 Geraldine Ct is a home located in Bergen County with nearby schools including North Cliff Elementary School, Upper School Elementary School, and Dwight-Englewood School.
Ownership History
Date
Name
Owned For
Owner Type
Purchase Details
Closed on
Dec 12, 2002
Sold by
Centrella Cosmo P
Bought by
Wong Robert
Current Estimated Value
Home Financials for this Owner
Home Financials are based on the most recent Mortgage that was taken out on this home.
Original Mortgage
$820,000
Interest Rate
5.94%
Mortgage Type
Purchase Money Mortgage
Create a Home Valuation Report for This Property
The Home Valuation Report is an in-depth analysis detailing your home's value as well as a comparison with similar homes in the area
Home Values in the Area
Average Home Value in this Area
Purchase History
| Date | Buyer | Sale Price | Title Company |
|---|---|---|---|
| Wong Robert | $1,025,000 | -- |
Source: Public Records
Mortgage History
| Date | Status | Borrower | Loan Amount |
|---|---|---|---|
| Previous Owner | Wong Robert | $820,000 |
Source: Public Records
Tax History Compared to Growth
Tax History
| Year | Tax Paid | Tax Assessment Tax Assessment Total Assessment is a certain percentage of the fair market value that is determined by local assessors to be the total taxable value of land and additions on the property. | Land | Improvement |
|---|---|---|---|---|
| 2025 | $15,881 | $1,375,000 | $1,092,600 | $282,400 |
| 2024 | $15,689 | $1,375,000 | $1,092,600 | $282,400 |
| 2023 | $15,441 | $1,375,000 | $1,092,600 | $282,400 |
| 2022 | $15,441 | $1,375,000 | $1,092,600 | $282,400 |
| 2021 | $11,870 | $1,375,000 | $1,092,600 | $282,400 |
| 2020 | $15,826 | $1,375,000 | $1,092,600 | $282,400 |
| 2019 | $15,726 | $1,454,800 | $1,092,600 | $362,200 |
| 2018 | $15,174 | $1,454,800 | $1,092,600 | $362,200 |
| 2017 | $14,519 | $1,454,800 | $1,092,600 | $362,200 |
| 2016 | $14,242 | $1,454,800 | $1,092,600 | $362,200 |
| 2015 | $13,530 | $1,454,800 | $1,092,600 | $362,200 |
| 2014 | $12,657 | $1,454,800 | $1,092,600 | $362,200 |
Source: Public Records
Map
Nearby Homes