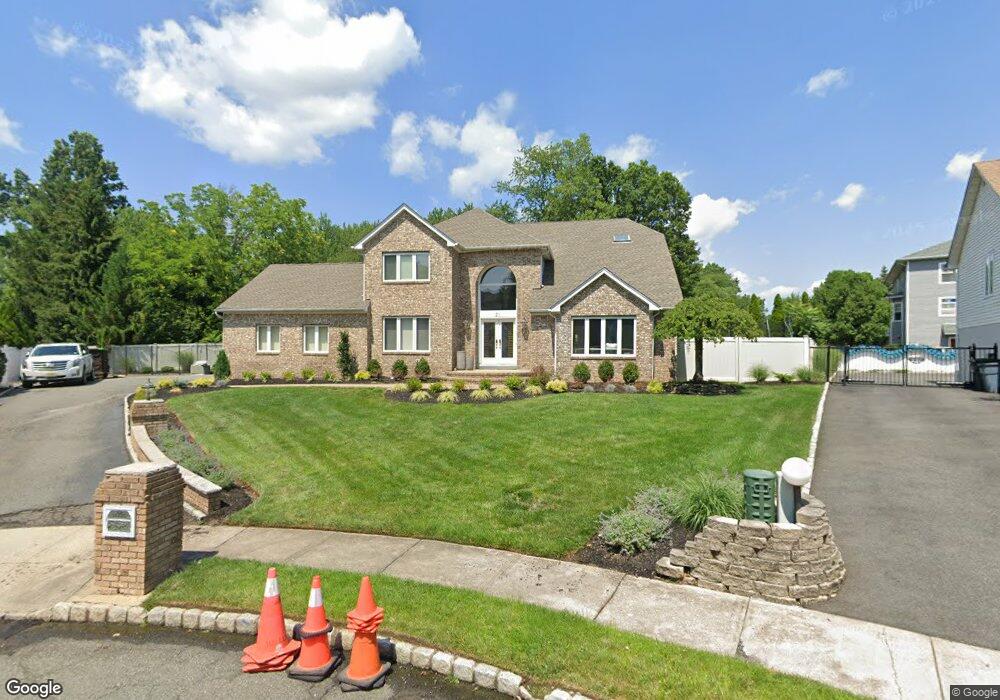
21 Glutting Place East Hanover, NJ 07936
Estimated Value: $1,086,782 - $1,250,000
--
Bed
--
Bath
2,840
Sq Ft
$416/Sq Ft
Est. Value
About This Home
This home is located at 21 Glutting Place, East Hanover, NJ 07936 and is currently estimated at $1,180,696, approximately $415 per square foot. 21 Glutting Place is a home located in Morris County with nearby schools including Frank J. Smith Elementary School, Central Elementary School, and East Hanover Middle School.
Ownership History
Date
Name
Owned For
Owner Type
Purchase Details
Closed on
Jul 2, 2010
Sold by
Emposimato Joanne
Bought by
Quintela Nicholas and Quintela Lisa
Current Estimated Value
Home Financials for this Owner
Home Financials are based on the most recent Mortgage that was taken out on this home.
Original Mortgage
$500,000
Outstanding Balance
$333,913
Interest Rate
4.82%
Mortgage Type
New Conventional
Estimated Equity
$846,783
Purchase Details
Closed on
Jan 7, 2004
Sold by
Emposimato Paul
Bought by
Emposimato Joanne
Purchase Details
Closed on
May 23, 1994
Sold by
Parkside Hills Estates
Bought by
Emposimato Paul and Imposimato Joanne
Home Financials for this Owner
Home Financials are based on the most recent Mortgage that was taken out on this home.
Original Mortgage
$341,000
Interest Rate
8.22%
Create a Home Valuation Report for This Property
The Home Valuation Report is an in-depth analysis detailing your home's value as well as a comparison with similar homes in the area
Home Values in the Area
Average Home Value in this Area
Purchase History
| Date | Buyer | Sale Price | Title Company |
|---|---|---|---|
| Quintela Nicholas | $690,000 | None Available | |
| Emposimato Joanne | -- | -- | |
| Emposimato Paul | $379,073 | -- |
Source: Public Records
Mortgage History
| Date | Status | Borrower | Loan Amount |
|---|---|---|---|
| Open | Quintela Nicholas | $500,000 | |
| Previous Owner | Emposimato Paul | $341,000 |
Source: Public Records
Tax History Compared to Growth
Tax History
| Year | Tax Paid | Tax Assessment Tax Assessment Total Assessment is a certain percentage of the fair market value that is determined by local assessors to be the total taxable value of land and additions on the property. | Land | Improvement |
|---|---|---|---|---|
| 2025 | $12,864 | $495,900 | $190,300 | $305,600 |
| 2024 | $12,373 | $495,900 | $190,300 | $305,600 |
| 2023 | $12,373 | $495,900 | $190,300 | $305,600 |
| 2022 | $12,090 | $495,900 | $190,300 | $305,600 |
| 2021 | $12,090 | $495,900 | $190,300 | $305,600 |
| 2020 | $11,852 | $495,900 | $190,300 | $305,600 |
| 2019 | $11,634 | $495,900 | $190,300 | $305,600 |
| 2018 | $11,282 | $495,900 | $190,300 | $305,600 |
| 2017 | $10,915 | $495,900 | $190,300 | $305,600 |
| 2016 | $10,766 | $495,900 | $190,300 | $305,600 |
| 2015 | $10,612 | $495,900 | $190,300 | $305,600 |
| 2014 | $10,384 | $495,900 | $190,300 | $305,600 |
Source: Public Records
Map
Nearby Homes