Estimated Value: $680,000 - $761,000
3
Beds
3
Baths
2,244
Sq Ft
$319/Sq Ft
Est. Value
About This Home
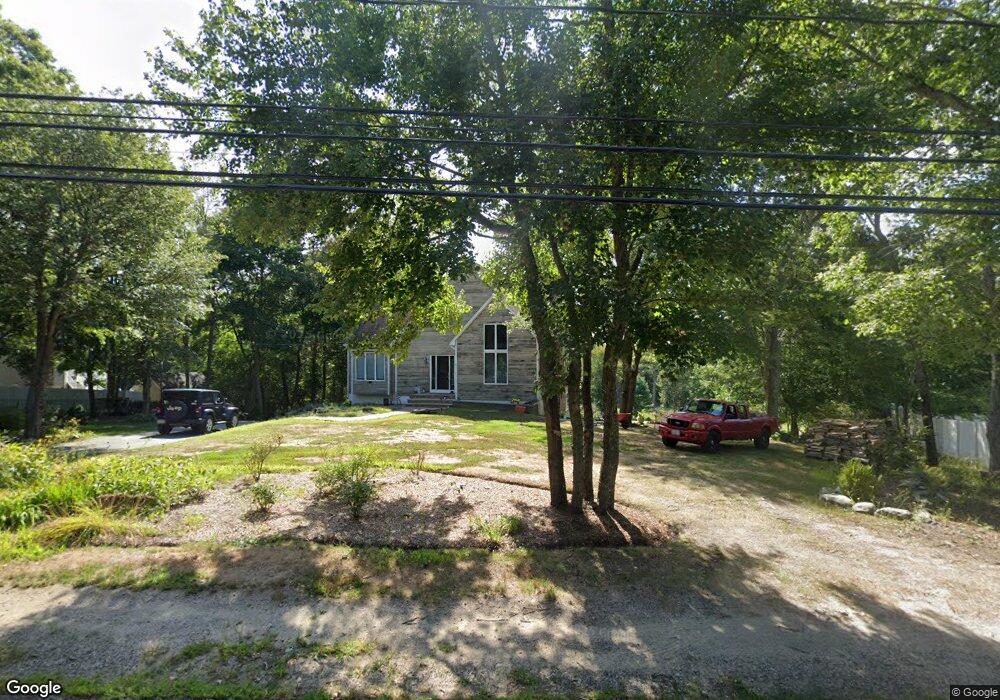
This home is located at 21 Green St, Berkley, MA 02779 and is currently estimated at $716,473, approximately $319 per square foot. 21 Green St is a home located in Bristol County with nearby schools including Berkley Community School and Our Lady of Lourdes School.
Ownership History
Date
Name
Owned For
Owner Type
Purchase Details
Closed on
May 12, 2006
Sold by
Arone Colleen M
Bought by
Arone Colleen M and Silvia John P
Current Estimated Value
Home Financials for this Owner
Home Financials are based on the most recent Mortgage that was taken out on this home.
Original Mortgage
$220,000
Outstanding Balance
$127,415
Interest Rate
6.4%
Mortgage Type
Purchase Money Mortgage
Estimated Equity
$589,058
Create a Home Valuation Report for This Property
The Home Valuation Report is an in-depth analysis detailing your home's value as well as a comparison with similar homes in the area
Home Values in the Area
Average Home Value in this Area
Purchase History
| Date | Buyer | Sale Price | Title Company |
|---|---|---|---|
| Arone Colleen M | -- | -- |
Source: Public Records
Mortgage History
| Date | Status | Borrower | Loan Amount |
|---|---|---|---|
| Open | Arone Colleen M | $220,000 |
Source: Public Records
Tax History Compared to Growth
Tax History
| Year | Tax Paid | Tax Assessment Tax Assessment Total Assessment is a certain percentage of the fair market value that is determined by local assessors to be the total taxable value of land and additions on the property. | Land | Improvement |
|---|---|---|---|---|
| 2025 | $76 | $630,500 | $142,900 | $487,600 |
| 2024 | $7,275 | $584,300 | $123,100 | $461,200 |
| 2023 | $6,894 | $521,500 | $123,100 | $398,400 |
| 2022 | $6,647 | $483,400 | $107,000 | $376,400 |
| 2021 | $6,503 | $455,400 | $101,900 | $353,500 |
| 2020 | $6,450 | $443,900 | $90,200 | $353,700 |
| 2019 | $6,278 | $428,800 | $90,200 | $338,600 |
| 2018 | $5,730 | $408,700 | $86,700 | $322,000 |
| 2017 | $5,557 | $388,600 | $97,200 | $291,400 |
| 2016 | $5,384 | $362,800 | $97,200 | $265,600 |
| 2015 | $5,063 | $364,000 | $97,200 | $266,800 |
| 2014 | $4,777 | $372,900 | $105,400 | $267,500 |
Source: Public Records
Map
Nearby Homes