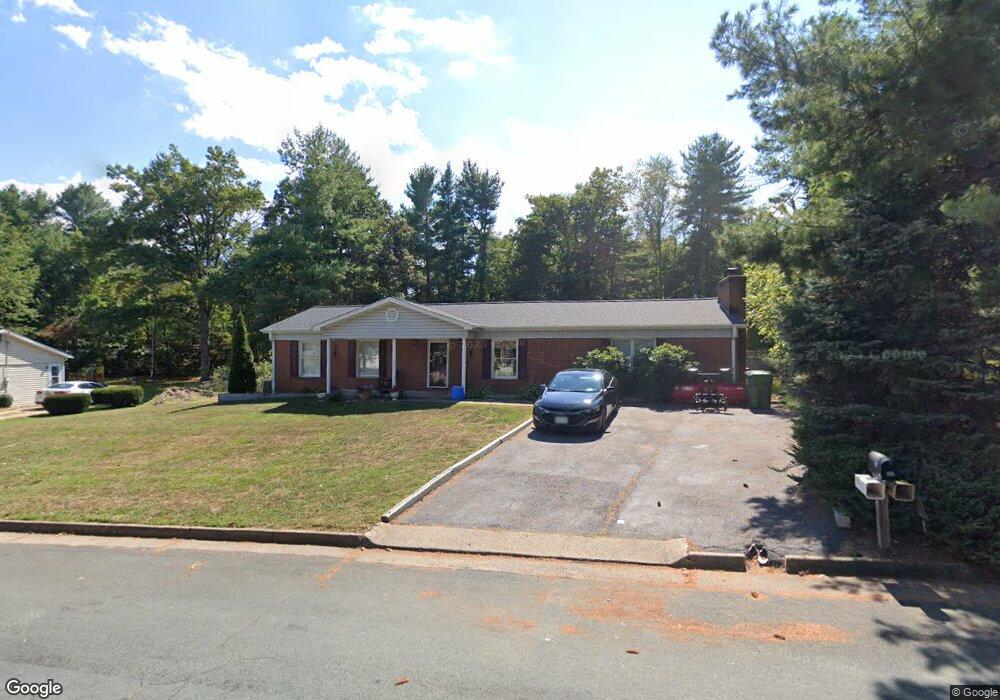
21 Greenbriar Ln Stuarts Draft, VA 24477
Estimated Value: $340,000 - $400,000
4
Beds
2
Baths
1,856
Sq Ft
$197/Sq Ft
Est. Value
About This Home
This home is located at 21 Greenbriar Ln, Stuarts Draft, VA 24477 and is currently estimated at $365,777, approximately $197 per square foot. 21 Greenbriar Ln is a home located in Augusta County with nearby schools including Guy K. Stump Elementary School, Stuarts Draft Middle School, and Stuarts Draft High School.
Ownership History
Date
Name
Owned For
Owner Type
Purchase Details
Closed on
Dec 13, 2017
Sold by
Whidon Joseph M and Whiddon Terri J
Bought by
Clements Clifton C and Clements Christine M
Current Estimated Value
Home Financials for this Owner
Home Financials are based on the most recent Mortgage that was taken out on this home.
Original Mortgage
$212,087
Outstanding Balance
$174,846
Interest Rate
3.95%
Mortgage Type
FHA
Estimated Equity
$190,931
Purchase Details
Closed on
Jul 28, 2014
Sold by
Flippin Cariton Wayne and Flippin Carol A
Bought by
Whiddon Joseph M and Whiddon Terri J
Home Financials for this Owner
Home Financials are based on the most recent Mortgage that was taken out on this home.
Original Mortgage
$199,900
Interest Rate
4.18%
Mortgage Type
VA
Create a Home Valuation Report for This Property
The Home Valuation Report is an in-depth analysis detailing your home's value as well as a comparison with similar homes in the area
Purchase History
| Date | Buyer | Sale Price | Title Company |
|---|---|---|---|
| Clements Clifton C | $216,000 | -- | |
| Whiddon Joseph M | $199,900 | Court Sq Title Agency Llc |
Source: Public Records
Mortgage History
| Date | Status | Borrower | Loan Amount |
|---|---|---|---|
| Open | Clements Clifton C | $212,087 | |
| Previous Owner | Whiddon Joseph M | $199,900 |
Source: Public Records
Tax History
| Year | Tax Paid | Tax Assessment Tax Assessment Total Assessment is a certain percentage of the fair market value that is determined by local assessors to be the total taxable value of land and additions on the property. | Land | Improvement |
|---|---|---|---|---|
| 2025 | $1,634 | $314,200 | $60,000 | $254,200 |
| 2024 | $1,634 | $314,200 | $60,000 | $254,200 |
| 2023 | $1,278 | $202,800 | $50,000 | $152,800 |
| 2022 | $1,278 | $202,800 | $50,000 | $152,800 |
| 2021 | $1,278 | $202,800 | $50,000 | $152,800 |
| 2020 | $1,278 | $202,800 | $50,000 | $152,800 |
| 2019 | $1,278 | $202,800 | $50,000 | $152,800 |
| 2018 | $1,195 | $189,746 | $50,000 | $139,746 |
| 2017 | $1,100 | $189,746 | $50,000 | $139,746 |
| 2016 | $1,100 | $189,746 | $50,000 | $139,746 |
| 2015 | $938 | $189,746 | $50,000 | $139,746 |
| 2014 | $938 | $189,746 | $50,000 | $139,746 |
| 2013 | $938 | $195,500 | $60,000 | $135,500 |
Source: Public Records
Map
Nearby Homes
- 38 Greenbriar Ln
- 501 Howardsville Turnpike
- 114 Jaspers Ln
- 77 Greenway Rd
- 87 Falling Rock Dr
- 251 Cooper Dr
- 165 Cooper Dr
- 294 Forest Springs Dr
- 253 Forest Springs Dr
- 124 Forest Springs Dr
- 12 Ceocia Ln
- 149 China Clay Rd
- 153 Sylvan Dr
- 117 Spring Ridge Dr
- 122 Spring Ridge Dr
- 38 Shady Pond Ln
- 1655 Howardsville Turnpike
- 0 Johnson Dr Unit 663189
- 42 Lynn Cir
- 00 Lipscomb Rd
Your Personal Tour Guide
Ask me questions while you tour the home.