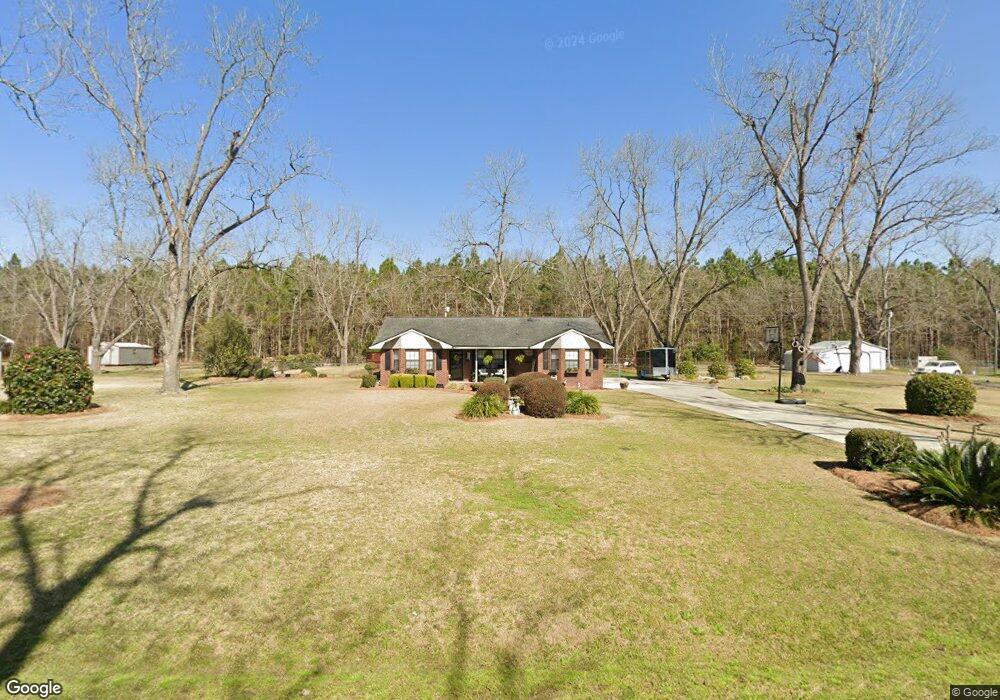
21 Grove Ln Claxton, GA 30417
Estimated Value: $213,000 - $323,000
3
Beds
3
Baths
2,230
Sq Ft
$117/Sq Ft
Est. Value
About This Home
This home is located at 21 Grove Ln, Claxton, GA 30417 and is currently estimated at $261,158, approximately $117 per square foot. 21 Grove Ln is a home located in Evans County with nearby schools including Claxton Elementary School, Second Chance, and Claxton Middle School.
Ownership History
Date
Name
Owned For
Owner Type
Purchase Details
Closed on
Mar 25, 2016
Sold by
Yancey Stanley Allen
Bought by
Smith Michelle Goodrich
Current Estimated Value
Home Financials for this Owner
Home Financials are based on the most recent Mortgage that was taken out on this home.
Original Mortgage
$150,000
Interest Rate
3.62%
Purchase Details
Closed on
May 30, 2006
Sold by
Cheek Alisa
Bought by
Yancey Stanley Allen and Yancey Marie R
Home Financials for this Owner
Home Financials are based on the most recent Mortgage that was taken out on this home.
Original Mortgage
$135,000
Interest Rate
6.51%
Purchase Details
Closed on
Dec 30, 2003
Sold by
Deloach Theron
Bought by
Cheek Alisa
Purchase Details
Closed on
Apr 17, 2002
Sold by
Jarriel Bobby C
Bought by
Deloach Theron
Purchase Details
Closed on
Aug 15, 1998
Sold by
Cribbs William Harri
Bought by
Jarriel Bobby C
Purchase Details
Closed on
Dec 13, 1993
Sold by
Dodd Gary W
Bought by
Cribbs William H
Create a Home Valuation Report for This Property
The Home Valuation Report is an in-depth analysis detailing your home's value as well as a comparison with similar homes in the area
Home Values in the Area
Average Home Value in this Area
Purchase History
| Date | Buyer | Sale Price | Title Company |
|---|---|---|---|
| Smith Michelle Goodrich | $150,000 | -- | |
| Yancey Stanley Allen | $135,000 | -- | |
| Cheek Alisa | $115,000 | -- | |
| Deloach Theron | $18,500 | -- | |
| Jarriel Bobby C | $1,000 | -- | |
| Cribbs William H | $5,300 | -- |
Source: Public Records
Mortgage History
| Date | Status | Borrower | Loan Amount |
|---|---|---|---|
| Closed | Smith Michelle Goodrich | $150,000 | |
| Previous Owner | Yancey Stanley Allen | $135,000 |
Source: Public Records
Tax History Compared to Growth
Tax History
| Year | Tax Paid | Tax Assessment Tax Assessment Total Assessment is a certain percentage of the fair market value that is determined by local assessors to be the total taxable value of land and additions on the property. | Land | Improvement |
|---|---|---|---|---|
| 2024 | $2,006 | $82,120 | $3,720 | $78,400 |
| 2023 | $1,882 | $60,280 | $3,880 | $56,400 |
| 2022 | $1,843 | $60,280 | $3,880 | $56,400 |
| 2021 | $1,913 | $60,280 | $3,880 | $56,400 |
| 2020 | $1,919 | $60,280 | $3,880 | $56,400 |
| 2019 | $1,878 | $60,280 | $3,880 | $56,400 |
| 2018 | $1,840 | $58,920 | $3,880 | $55,040 |
| 2017 | $1,751 | $60,280 | $3,880 | $56,400 |
| 2016 | $1,429 | $50,600 | $4,040 | $46,560 |
| 2015 | -- | $51,680 | $4,040 | $47,640 |
| 2014 | -- | $51,680 | $4,040 | $47,640 |
| 2013 | -- | $53,320 | $4,040 | $49,280 |
Source: Public Records
Map
Nearby Homes
- 29 Grove Ln
- 19 Collins St
- 0 Turnpike Rd Unit SA339603
- 4909 Perry Rd
- 19 Wysteria Ln
- 12 Wisteria Ln
- 12 Wysteria Ln
- 0 Dublin Rd
- 606 Park Ave
- 10 Honeysuckle Dr
- 7 Honeysuckle Way
- 308 Old Metter Rd
- 9 Honeysuckle Dr
- 7 Honeysuckle Dr
- 3 Honeysuckle Dr
- 610 W Liberty St
- 511 W Smith St
- 107 Marguerite St
- 3 S Spring St
- 6 N Spring St
- 23 Grove Ln
- 17 Grove Ln
- 0 Grove Ln Unit 8896335
- 0 Grove Ln Unit 8553067
- 16 Grove Ln
- 5812 Tattnall St
- 20 Grove Ln
- 5762 Tattnall St
- 63 Grove Ln
- 62 Grove Ln
- 5742a Tattnall St
- 5742 Tattnall St
- 5736A Tattnall St
- 67 Grove Ln
- 5833 Tattnall St
- 34 Threatt St
- 68 Grove Ln
- 6416 Tattnall St
- 6028 Tattnall St
- 6027 Tattnall St