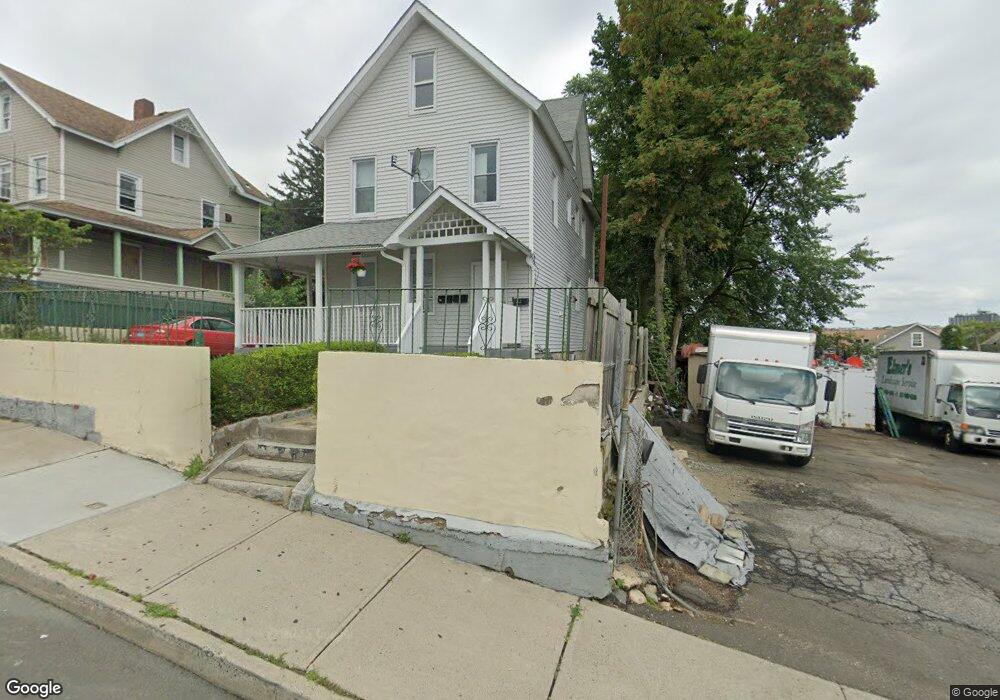
21 Grove St Norwalk, CT 06854
South Norwalk NeighborhoodEstimated Value: $656,000 - $901,000
5
Beds
3
Baths
2,338
Sq Ft
$316/Sq Ft
Est. Value
About This Home
This home is located at 21 Grove St, Norwalk, CT 06854 and is currently estimated at $737,836, approximately $315 per square foot. 21 Grove St is a home located in Fairfield County with nearby schools including Wolfpit School, Nathan Hale Middle School, and Norwalk High School.
Ownership History
Date
Name
Owned For
Owner Type
Purchase Details
Closed on
Apr 3, 2003
Sold by
Revelo Martha
Bought by
Villacis Jose M and Villacis Marcia Y
Current Estimated Value
Purchase Details
Closed on
Dec 27, 2001
Sold by
Ahmed Jafar
Bought by
Revelo Martha E
Purchase Details
Closed on
Jun 5, 2000
Sold by
Rios Maria and Avila Sylvia
Bought by
Ahmed Jafar and Ahmed Farid
Purchase Details
Closed on
Jun 17, 1998
Sold by
Mcenroe Sean
Bought by
Salazar Carlos and Rios Maria
Purchase Details
Closed on
Jan 29, 1998
Sold by
Thompson Barbara
Bought by
Mcenroe Sean
Purchase Details
Closed on
Apr 18, 1995
Sold by
Chemical Bk
Bought by
Smith Hawthon
Purchase Details
Closed on
Dec 15, 1989
Sold by
Parker Ricky
Bought by
Williams Sharon
Create a Home Valuation Report for This Property
The Home Valuation Report is an in-depth analysis detailing your home's value as well as a comparison with similar homes in the area
Home Values in the Area
Average Home Value in this Area
Purchase History
| Date | Buyer | Sale Price | Title Company |
|---|---|---|---|
| Villacis Jose M | $380,000 | -- | |
| Villacis Jose M | $380,000 | -- | |
| Revelo Martha E | $300,000 | -- | |
| Revelo Martha E | $300,000 | -- | |
| Ahmed Jafar | $267,500 | -- | |
| Ahmed Jafar | $267,500 | -- | |
| Salazar Carlos | $230,000 | -- | |
| Salazar Carlos | $230,000 | -- | |
| Mcenroe Sean | $38,500 | -- | |
| Thompson Barbara | $38,500 | -- | |
| Thompson Barbara | $38,500 | -- | |
| Smith Hawthon | $125,000 | -- | |
| Smith Hawthon | $125,000 | -- | |
| Williams Sharon | $255,000 | -- |
Source: Public Records
Mortgage History
| Date | Status | Borrower | Loan Amount |
|---|---|---|---|
| Open | Williams Sharon | $406,000 |
Source: Public Records
Tax History Compared to Growth
Tax History
| Year | Tax Paid | Tax Assessment Tax Assessment Total Assessment is a certain percentage of the fair market value that is determined by local assessors to be the total taxable value of land and additions on the property. | Land | Improvement |
|---|---|---|---|---|
| 2025 | $8,744 | $365,840 | $107,160 | $258,680 |
| 2024 | $8,614 | $365,840 | $107,160 | $258,680 |
| 2023 | $6,292 | $250,830 | $98,220 | $152,610 |
| 2022 | $6,157 | $250,830 | $98,220 | $152,610 |
| 2021 | $6,012 | $250,830 | $98,220 | $152,610 |
| 2020 | $6,009 | $250,830 | $98,220 | $152,610 |
| 2019 | $5,848 | $250,830 | $98,220 | $152,610 |
| 2018 | $5,026 | $188,930 | $95,550 | $93,380 |
| 2017 | $4,852 | $188,930 | $95,550 | $93,380 |
| 2016 | $4,806 | $188,930 | $95,550 | $93,380 |
| 2015 | $4,793 | $188,930 | $95,550 | $93,380 |
| 2014 | $4,731 | $188,930 | $95,550 | $93,380 |
Source: Public Records
Map
Nearby Homes
- 28 Chestnut St
- 52 Lexington Ave
- 58 Shorefront Park
- 15 Madison St Unit F9
- 15 Madison St Unit G11
- 134 Washington St Unit 206
- 94 Washington St Unit 20
- 110 Washington St Unit 202
- 118 Washington St Unit 309
- 118 Washington St Unit 304
- 41 Baxter Dr
- 83 Washington St Unit STE 2C
- 18 Soundview Ave
- 9 Observatory Place Unit A
- 187 Flax Hill Rd Unit D5
- 187 Flax Hill Rd Unit A4
- 135 Flax Hill Rd Unit 21
- 16 Hillside Place Unit J4
- 16 Hillside Place Unit M5
- 10 Ann St Unit 206