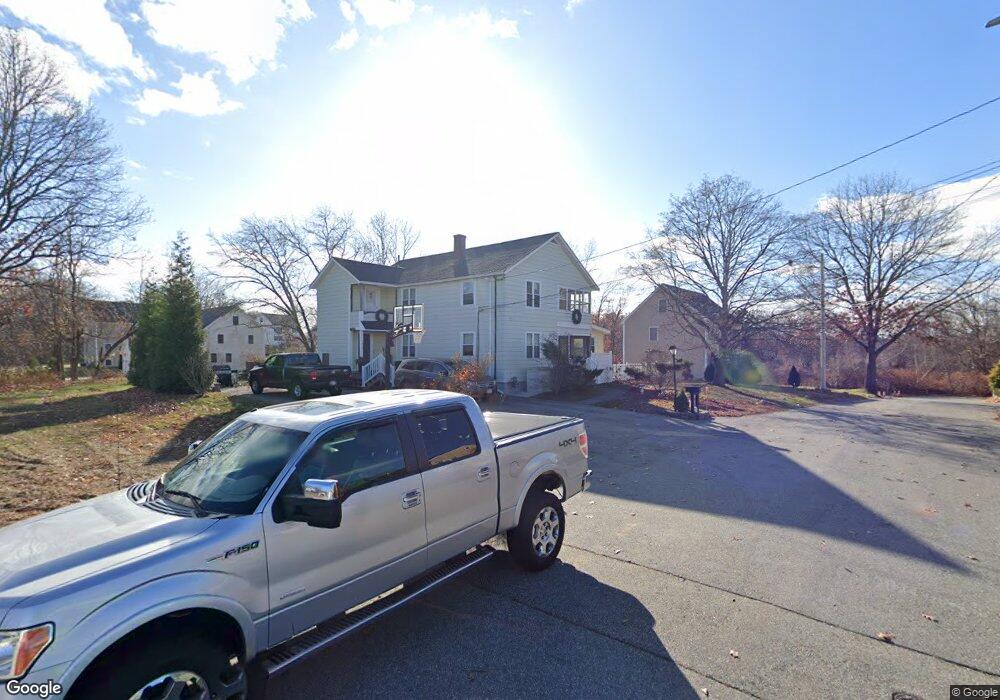
21 Hale St Unit 23 Lawrence, MA 01843
Mount Vernon NeighborhoodEstimated Value: $668,000 - $848,000
4
Beds
2
Baths
2,604
Sq Ft
$293/Sq Ft
Est. Value
About This Home
This home is located at 21 Hale St Unit 23, Lawrence, MA 01843 and is currently estimated at $763,509, approximately $293 per square foot. 21 Hale St Unit 23 is a home located in Essex County with nearby schools including Olive Branch Elementary School, John Breen School, and School For Exceptional Studies.
Ownership History
Date
Name
Owned For
Owner Type
Purchase Details
Closed on
Mar 15, 2011
Sold by
Blanchette William J and Blanchette Kim P
Bought by
Tetrault Mark J and Tetrault Lisa A
Current Estimated Value
Home Financials for this Owner
Home Financials are based on the most recent Mortgage that was taken out on this home.
Original Mortgage
$128,500
Outstanding Balance
$88,458
Interest Rate
4.83%
Mortgage Type
Purchase Money Mortgage
Estimated Equity
$675,051
Create a Home Valuation Report for This Property
The Home Valuation Report is an in-depth analysis detailing your home's value as well as a comparison with similar homes in the area
Home Values in the Area
Average Home Value in this Area
Purchase History
| Date | Buyer | Sale Price | Title Company |
|---|---|---|---|
| Tetrault Mark J | $123,750 | -- | |
| Tetrault Mark J | $123,750 | -- |
Source: Public Records
Mortgage History
| Date | Status | Borrower | Loan Amount |
|---|---|---|---|
| Open | Tetrault Mark J | $128,500 | |
| Closed | Tetrault Mark J | $128,500 |
Source: Public Records
Tax History Compared to Growth
Tax History
| Year | Tax Paid | Tax Assessment Tax Assessment Total Assessment is a certain percentage of the fair market value that is determined by local assessors to be the total taxable value of land and additions on the property. | Land | Improvement |
|---|---|---|---|---|
| 2025 | $6,530 | $742,100 | $201,300 | $540,800 |
| 2024 | $5,988 | $647,300 | $168,600 | $478,700 |
| 2023 | $6,147 | $605,000 | $150,900 | $454,100 |
| 2022 | $5,347 | $467,400 | $140,500 | $326,900 |
| 2021 | $5,241 | $427,100 | $137,400 | $289,700 |
| 2020 | $4,915 | $395,400 | $119,700 | $275,700 |
| 2019 | $5,025 | $367,300 | $119,100 | $248,200 |
| 2018 | $4,767 | $332,900 | $114,100 | $218,800 |
| 2017 | $4,639 | $302,400 | $113,300 | $189,100 |
| 2016 | $4,363 | $281,300 | $105,300 | $176,000 |
| 2015 | $4,078 | $269,700 | $105,300 | $164,400 |
Source: Public Records
Map
Nearby Homes