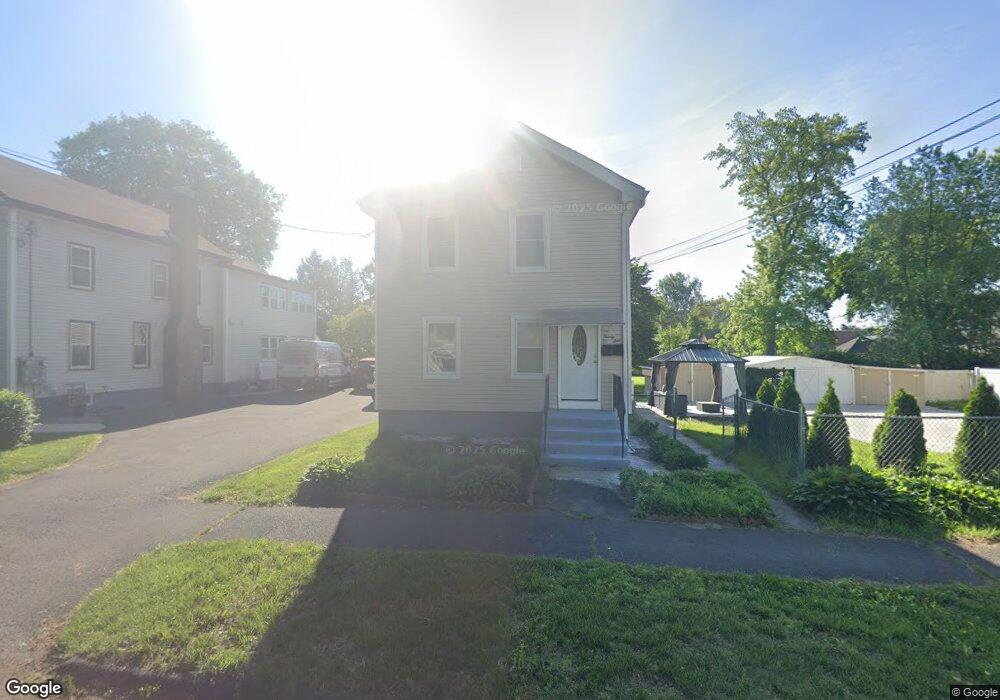
21 Hampden St Westfield, MA 01085
Estimated Value: $258,000 - $349,000
6
Beds
2
Baths
1,960
Sq Ft
$158/Sq Ft
Est. Value
About This Home
This home is located at 21 Hampden St, Westfield, MA 01085 and is currently estimated at $310,259, approximately $158 per square foot. 21 Hampden St is a home located in Hampden County with nearby schools including Westfield High School and Saint Mary High School.
Ownership History
Date
Name
Owned For
Owner Type
Purchase Details
Closed on
Apr 6, 2021
Sold by
Kulyak Dmitriy and Kulyak Viktor
Bought by
Kulyak Viktor D
Current Estimated Value
Purchase Details
Closed on
Oct 12, 2010
Sold by
Gandrabura Ivan
Bought by
Kulyak Viktor and Kulyak Dmitriy
Home Financials for this Owner
Home Financials are based on the most recent Mortgage that was taken out on this home.
Original Mortgage
$192,230
Interest Rate
4.25%
Mortgage Type
FHA
Purchase Details
Closed on
Sep 4, 2008
Sold by
Kulyak Viktor and Kulyak Dmitry
Bought by
Kulyak Viktor and Kulyak Dmitry
Home Financials for this Owner
Home Financials are based on the most recent Mortgage that was taken out on this home.
Original Mortgage
$187,000
Interest Rate
6.69%
Mortgage Type
Purchase Money Mortgage
Purchase Details
Closed on
Jun 27, 2006
Sold by
Kulyak Anatoliy and Kulyak Yuliya
Bought by
Kulyak Dmitriy and Kulyak Viktor
Home Financials for this Owner
Home Financials are based on the most recent Mortgage that was taken out on this home.
Original Mortgage
$169,600
Interest Rate
6.59%
Mortgage Type
Purchase Money Mortgage
Purchase Details
Closed on
Jun 1, 2005
Sold by
Santos Jose S and Santos Marilia R
Bought by
Kulyak Anatoliy
Home Financials for this Owner
Home Financials are based on the most recent Mortgage that was taken out on this home.
Original Mortgage
$165,300
Interest Rate
5.83%
Mortgage Type
Purchase Money Mortgage
Purchase Details
Closed on
Apr 18, 1989
Sold by
Clendenin Keith R
Bought by
Santos Jose S
Home Financials for this Owner
Home Financials are based on the most recent Mortgage that was taken out on this home.
Original Mortgage
$97,600
Interest Rate
10.85%
Mortgage Type
Purchase Money Mortgage
Purchase Details
Closed on
May 5, 1987
Sold by
Monnier Charles T
Bought by
Clendenin Keith R
Home Financials for this Owner
Home Financials are based on the most recent Mortgage that was taken out on this home.
Original Mortgage
$75,100
Interest Rate
8.99%
Mortgage Type
Purchase Money Mortgage
Create a Home Valuation Report for This Property
The Home Valuation Report is an in-depth analysis detailing your home's value as well as a comparison with similar homes in the area
Home Values in the Area
Average Home Value in this Area
Purchase History
| Date | Buyer | Sale Price | Title Company |
|---|---|---|---|
| Kulyak Viktor D | -- | None Available | |
| Kulyak Viktor | -- | -- | |
| Kulyak Viktor | -- | -- | |
| Kulyak Dmitriy | $214,900 | -- | |
| Kulyak Anatoliy | $174,000 | -- | |
| Santos Jose S | $122,000 | -- | |
| Clendenin Keith R | $93,900 | -- |
Source: Public Records
Mortgage History
| Date | Status | Borrower | Loan Amount |
|---|---|---|---|
| Previous Owner | Kulyak Viktor | $192,230 | |
| Previous Owner | Kulyak Viktor | $187,000 | |
| Previous Owner | Kulyak Dmitriy | $169,600 | |
| Previous Owner | Kulyak Dmitriy | $42,400 | |
| Previous Owner | Kulyak Anatoliy | $165,300 | |
| Previous Owner | Clendenin Keith R | $72,000 | |
| Previous Owner | Clendenin Keith R | $97,600 | |
| Previous Owner | Clendenin Keith R | $75,100 |
Source: Public Records
Tax History Compared to Growth
Tax History
| Year | Tax Paid | Tax Assessment Tax Assessment Total Assessment is a certain percentage of the fair market value that is determined by local assessors to be the total taxable value of land and additions on the property. | Land | Improvement |
|---|---|---|---|---|
| 2025 | $3,658 | $241,000 | $78,800 | $162,200 |
| 2024 | $3,612 | $226,200 | $71,700 | $154,500 |
| 2023 | $3,469 | $204,300 | $68,300 | $136,000 |
| 2022 | $3,411 | $184,500 | $60,900 | $123,600 |
| 2021 | $1,268 | $175,000 | $57,500 | $117,500 |
| 2020 | $1,128 | $165,700 | $57,500 | $108,200 |
| 2019 | $1,088 | $158,400 | $54,800 | $103,600 |
| 2018 | $2,768 | $143,000 | $54,800 | $88,200 |
| 2017 | $2,730 | $140,600 | $55,500 | $85,100 |
| 2016 | $2,733 | $140,600 | $55,500 | $85,100 |
| 2015 | $2,607 | $140,600 | $55,500 | $85,100 |
| 2014 | $1,946 | $140,600 | $55,500 | $85,100 |
Source: Public Records
Map
Nearby Homes