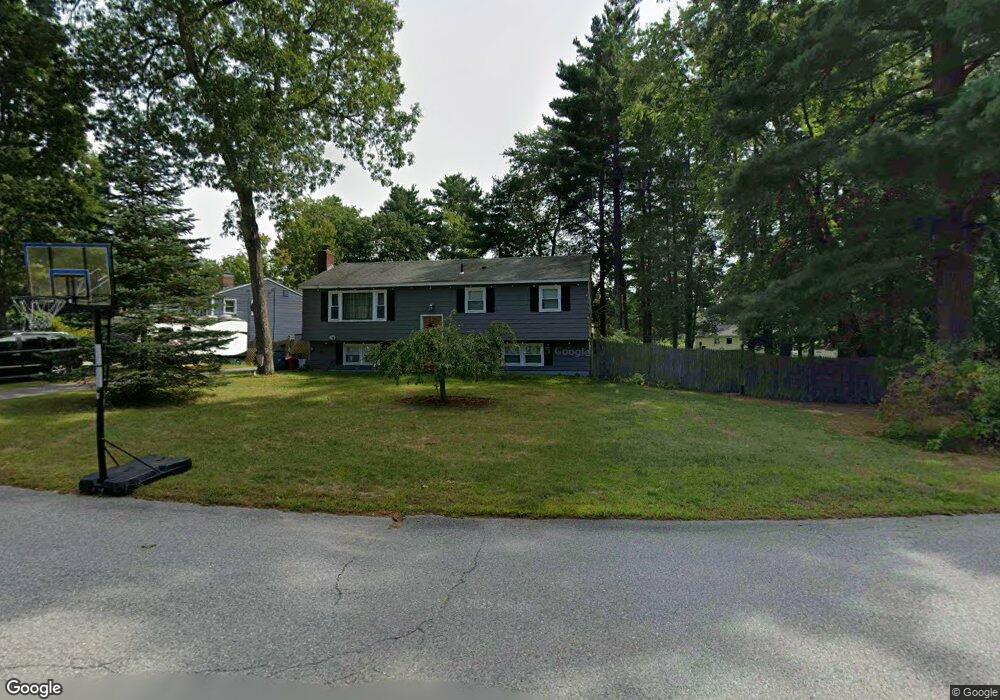
21 Haskell Rd Pepperell, MA 01463
Estimated Value: $467,619 - $499,000
3
Beds
1
Bath
1,340
Sq Ft
$358/Sq Ft
Est. Value
About This Home
This home is located at 21 Haskell Rd, Pepperell, MA 01463 and is currently estimated at $479,155, approximately $357 per square foot. 21 Haskell Rd is a home located in Middlesex County with nearby schools including North Middlesex Regional High School, Pepperell Christian Academy, and Maple Dene & Moppet School.
Ownership History
Date
Name
Owned For
Owner Type
Purchase Details
Closed on
Jun 28, 2007
Sold by
Parenteau Susan J
Bought by
Blauvelt Jennifer and Santosuosso Joseph
Current Estimated Value
Home Financials for this Owner
Home Financials are based on the most recent Mortgage that was taken out on this home.
Original Mortgage
$269,000
Outstanding Balance
$165,837
Interest Rate
6.24%
Mortgage Type
Purchase Money Mortgage
Estimated Equity
$313,318
Purchase Details
Closed on
Apr 26, 2002
Sold by
Cannon David W and Cannon Deborah J
Bought by
Parenteau William C and Parenteau Susan J
Home Financials for this Owner
Home Financials are based on the most recent Mortgage that was taken out on this home.
Original Mortgage
$205,200
Interest Rate
7.05%
Mortgage Type
Purchase Money Mortgage
Create a Home Valuation Report for This Property
The Home Valuation Report is an in-depth analysis detailing your home's value as well as a comparison with similar homes in the area
Home Values in the Area
Average Home Value in this Area
Purchase History
| Date | Buyer | Sale Price | Title Company |
|---|---|---|---|
| Blauvelt Jennifer | $269,000 | -- | |
| Parenteau William C | $216,000 | -- |
Source: Public Records
Mortgage History
| Date | Status | Borrower | Loan Amount |
|---|---|---|---|
| Open | Blauvelt Jennifer | $269,000 | |
| Previous Owner | Parenteau William C | $205,200 |
Source: Public Records
Tax History
| Year | Tax Paid | Tax Assessment Tax Assessment Total Assessment is a certain percentage of the fair market value that is determined by local assessors to be the total taxable value of land and additions on the property. | Land | Improvement |
|---|---|---|---|---|
| 2025 | $5,669 | $387,500 | $141,500 | $246,000 |
| 2024 | $5,162 | $359,700 | $129,200 | $230,500 |
| 2023 | $4,836 | $319,400 | $116,900 | $202,500 |
| 2022 | $4,490 | $261,800 | $104,600 | $157,200 |
| 2021 | $4,419 | $246,600 | $92,300 | $154,300 |
| 2020 | $4,187 | $246,600 | $92,300 | $154,300 |
| 2019 | $3,922 | $236,400 | $92,300 | $144,100 |
| 2018 | $6,129 | $217,400 | $92,300 | $125,100 |
| 2017 | $3,381 | $212,800 | $92,300 | $120,500 |
| 2016 | $3,235 | $195,700 | $92,300 | $103,400 |
| 2015 | $3,121 | $195,700 | $92,300 | $103,400 |
| 2014 | $2,907 | $183,300 | $86,100 | $97,200 |
Source: Public Records
Map
Nearby Homes
- 38 Tarbell St Unit 5B
- 38 Tarbell St Unit 1D
- 29 Tarbell St
- 28-30 Groton St
- 8 Casie Ln
- 208 North St
- 114 Groton St
- 10 Bennett St
- 39 Hollis St Unit A
- 179 Wyman Rd
- 11 Unkety Brook Way
- 12 Unkety Brook Way
- 14 Brookline St
- 38 River Rd Unit 11
- 235 Kemp St
- 147 Nashua Rd
- 53 Mclains Woods Rd
- 13 Birch Dr
- 1 Nashua Rd
- 77 Birchwood Dr
Your Personal Tour Guide
Ask me questions while you tour the home.