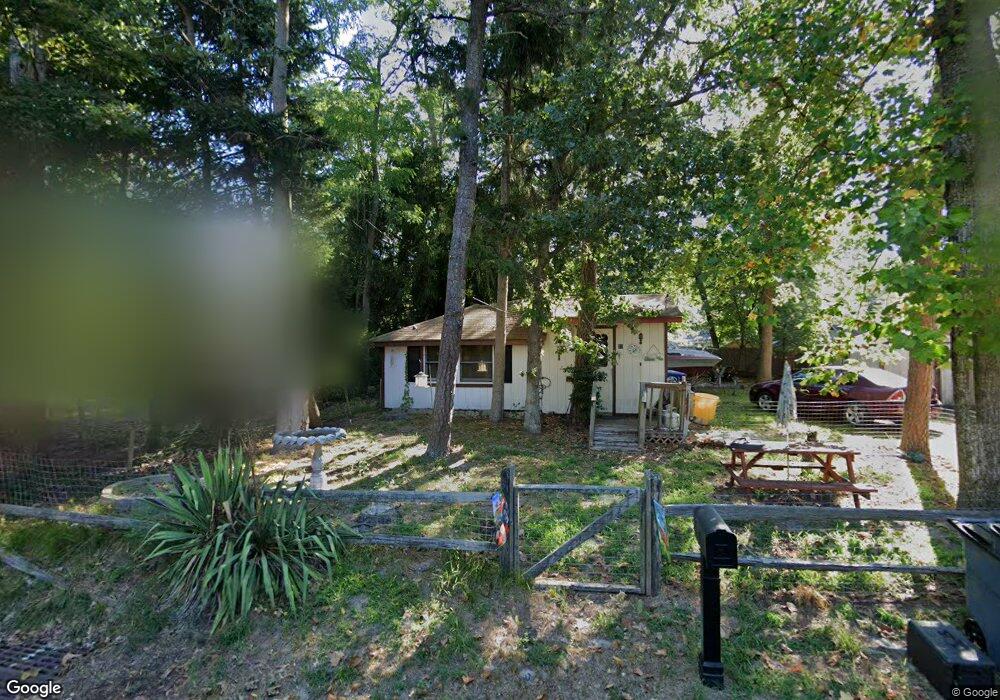
21 Hawthorne St Browns Mills, NJ 08015
Estimated Value: $171,378 - $248,000
--
Bed
--
Bath
512
Sq Ft
$399/Sq Ft
Est. Value
About This Home
This home is located at 21 Hawthorne St, Browns Mills, NJ 08015 and is currently estimated at $204,095, approximately $398 per square foot. 21 Hawthorne St is a home located in Burlington County.
Ownership History
Date
Name
Owned For
Owner Type
Purchase Details
Closed on
Jun 21, 2005
Sold by
Dewey Richard A and Dewey Daniel A
Bought by
Dewey Daniel A
Current Estimated Value
Home Financials for this Owner
Home Financials are based on the most recent Mortgage that was taken out on this home.
Original Mortgage
$50,490
Interest Rate
5.71%
Mortgage Type
New Conventional
Purchase Details
Closed on
Jul 24, 1996
Sold by
Cassidy Michael D and Cassidy Christine
Bought by
Dewey Richard A and Dewey Elsie L
Create a Home Valuation Report for This Property
The Home Valuation Report is an in-depth analysis detailing your home's value as well as a comparison with similar homes in the area
Home Values in the Area
Average Home Value in this Area
Purchase History
| Date | Buyer | Sale Price | Title Company |
|---|---|---|---|
| Dewey Daniel A | $56,100 | Congress Title Corp | |
| Dewey Richard A | $38,000 | The Guardian Title Agency In |
Source: Public Records
Mortgage History
| Date | Status | Borrower | Loan Amount |
|---|---|---|---|
| Previous Owner | Dewey Daniel A | $50,490 |
Source: Public Records
Tax History Compared to Growth
Tax History
| Year | Tax Paid | Tax Assessment Tax Assessment Total Assessment is a certain percentage of the fair market value that is determined by local assessors to be the total taxable value of land and additions on the property. | Land | Improvement |
|---|---|---|---|---|
| 2025 | $2,676 | $87,300 | $40,000 | $47,300 |
| 2024 | $2,511 | $87,300 | $40,000 | $47,300 |
| 2023 | $2,511 | $87,300 | $40,000 | $47,300 |
| 2022 | $2,324 | $87,300 | $40,000 | $47,300 |
| 2021 | $2,229 | $87,300 | $40,000 | $47,300 |
| 2020 | $2,145 | $87,300 | $40,000 | $47,300 |
| 2019 | $2,054 | $87,300 | $40,000 | $47,300 |
| 2018 | $1,984 | $87,300 | $40,000 | $47,300 |
| 2017 | $1,943 | $87,300 | $40,000 | $47,300 |
| 2016 | $1,570 | $42,000 | $22,500 | $19,500 |
| 2015 | $1,557 | $42,000 | $22,500 | $19,500 |
| 2014 | $1,489 | $42,000 | $22,500 | $19,500 |
Source: Public Records
Map
Nearby Homes