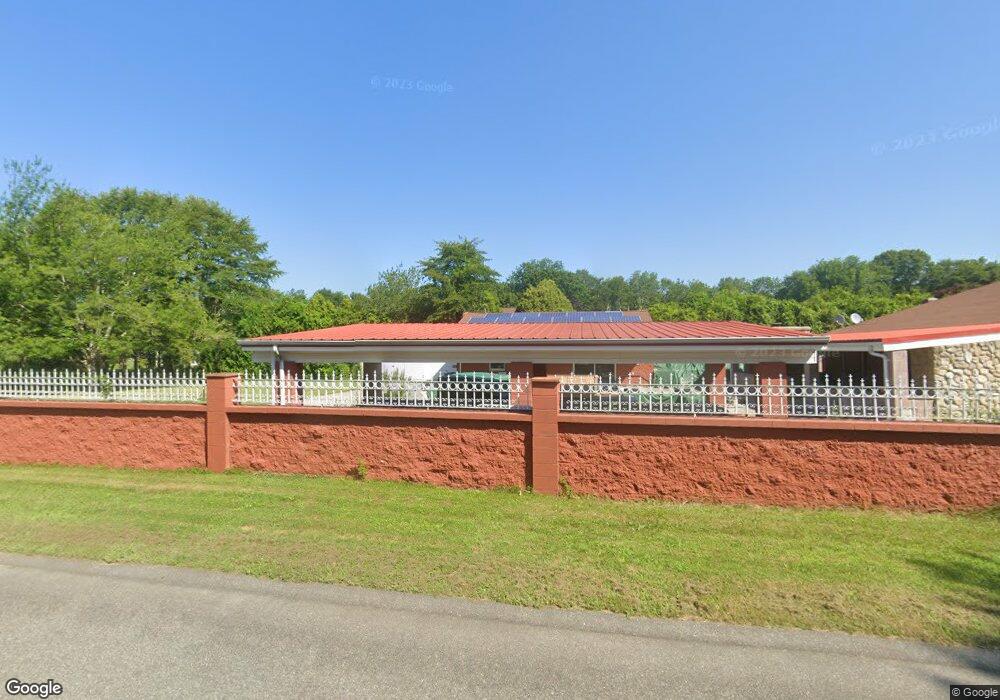
21 Hemlock St Fairhaven, MA 02719
Oxford NeighborhoodEstimated Value: $574,000 - $624,000
5
Beds
2
Baths
1,904
Sq Ft
$311/Sq Ft
Est. Value
About This Home
This home is located at 21 Hemlock St, Fairhaven, MA 02719 and is currently estimated at $591,341, approximately $310 per square foot. 21 Hemlock St is a home located in Bristol County with nearby schools including Fairhaven High School, Alma Del Mar Charter School, and City On A Hill Charter Public School New Bedford.
Ownership History
Date
Name
Owned For
Owner Type
Purchase Details
Closed on
Dec 10, 1996
Sold by
Mitcheson James A and Mitcheson Marsha A
Bought by
Hunt Joanna M and Hunt Steven C
Current Estimated Value
Home Financials for this Owner
Home Financials are based on the most recent Mortgage that was taken out on this home.
Original Mortgage
$95,000
Outstanding Balance
$9,770
Interest Rate
7.83%
Mortgage Type
Purchase Money Mortgage
Estimated Equity
$581,571
Create a Home Valuation Report for This Property
The Home Valuation Report is an in-depth analysis detailing your home's value as well as a comparison with similar homes in the area
Home Values in the Area
Average Home Value in this Area
Purchase History
| Date | Buyer | Sale Price | Title Company |
|---|---|---|---|
| Hunt Joanna M | $145,000 | -- |
Source: Public Records
Mortgage History
| Date | Status | Borrower | Loan Amount |
|---|---|---|---|
| Open | Hunt Joanna M | $55,000 | |
| Open | Hunt Joanna M | $95,000 | |
| Previous Owner | Hunt Joanna M | $126,500 |
Source: Public Records
Tax History
| Year | Tax Paid | Tax Assessment Tax Assessment Total Assessment is a certain percentage of the fair market value that is determined by local assessors to be the total taxable value of land and additions on the property. | Land | Improvement |
|---|---|---|---|---|
| 2025 | $38 | $406,800 | $181,700 | $225,100 |
| 2024 | $3,692 | $400,000 | $181,700 | $218,300 |
| 2023 | $3,538 | $355,600 | $159,500 | $196,100 |
| 2022 | $3,481 | $340,600 | $148,400 | $192,200 |
| 2021 | $2,784 | $310,300 | $134,500 | $175,800 |
| 2020 | $3,432 | $310,300 | $134,500 | $175,800 |
| 2019 | $2,505 | $278,400 | $112,000 | $166,400 |
| 2018 | $2,118 | $265,100 | $106,800 | $158,300 |
| 2017 | $3,192 | $265,100 | $106,800 | $158,300 |
| 2016 | $3,038 | $249,400 | $106,800 | $142,600 |
| 2015 | $2,997 | $246,700 | $106,800 | $139,900 |
Source: Public Records
Map
Nearby Homes
- 15 School St
- 16 Ash St
- 24 Academy Ave
- 67 Bridge St
- 442 Dana Farms
- 39 Christian St
- 138 Main St Unit 13
- 77 Adams St
- 313 Main St
- 253 Adams St
- 145 Pleasant St
- 14 Sycamore St
- 10 Livesey Pkwy
- 58 Washington St
- 0 Nulands Neck Unit 73286360
- 181 Washington St
- 8 Washington St
- 71 Sycamore St
- 8 Manor Dr
- 24 Middle St
Your Personal Tour Guide
Ask me questions while you tour the home.