21 Hidden Shores Ln South Dennis, MA 02660
West Dennis NeighborhoodEstimated Value: $697,602 - $813,000
2
Beds
2
Baths
1,501
Sq Ft
$491/Sq Ft
Est. Value
About This Home
This home is located at 21 Hidden Shores Ln, South Dennis, MA 02660 and is currently estimated at $736,401, approximately $490 per square foot. 21 Hidden Shores Ln is a home located in Barnstable County with nearby schools including Dennis-Yarmouth Regional High School and St. Pius X. School.
Ownership History
Date
Name
Owned For
Owner Type
Purchase Details
Closed on
Aug 29, 2002
Sold by
Arsenault Samuel J
Bought by
Vaughan Suzanne P and Williamson Carole A
Current Estimated Value
Home Financials for this Owner
Home Financials are based on the most recent Mortgage that was taken out on this home.
Original Mortgage
$232,500
Outstanding Balance
$99,317
Interest Rate
6.55%
Mortgage Type
Purchase Money Mortgage
Estimated Equity
$637,084
Create a Home Valuation Report for This Property
The Home Valuation Report is an in-depth analysis detailing your home's value as well as a comparison with similar homes in the area
Home Values in the Area
Average Home Value in this Area
Purchase History
| Date | Buyer | Sale Price | Title Company |
|---|---|---|---|
| Vaughan Suzanne P | $310,000 | -- |
Source: Public Records
Mortgage History
| Date | Status | Borrower | Loan Amount |
|---|---|---|---|
| Open | Vaughan Suzanne P | $232,500 | |
| Previous Owner | Vaughan Suzanne P | $15,000 |
Source: Public Records
Tax History Compared to Growth
Tax History
| Year | Tax Paid | Tax Assessment Tax Assessment Total Assessment is a certain percentage of the fair market value that is determined by local assessors to be the total taxable value of land and additions on the property. | Land | Improvement |
|---|---|---|---|---|
| 2025 | $2,932 | $677,200 | $165,100 | $512,100 |
| 2024 | $2,803 | $638,400 | $158,800 | $479,600 |
| 2023 | $2,853 | $611,000 | $144,300 | $466,700 |
| 2022 | $2,589 | $462,300 | $118,200 | $344,100 |
| 2021 | $0 | $419,100 | $104,300 | $314,800 |
| 2020 | $3,143 | $389,800 | $104,300 | $285,500 |
| 2019 | $2,266 | $367,200 | $113,600 | $253,600 |
| 2018 | $2,855 | $338,700 | $108,200 | $230,500 |
| 2017 | $2,809 | $331,200 | $108,200 | $223,000 |
| 2016 | $2,022 | $309,700 | $119,000 | $190,700 |
| 2015 | $1,982 | $309,700 | $119,000 | $190,700 |
| 2014 | $1,967 | $309,700 | $119,000 | $190,700 |
Source: Public Records
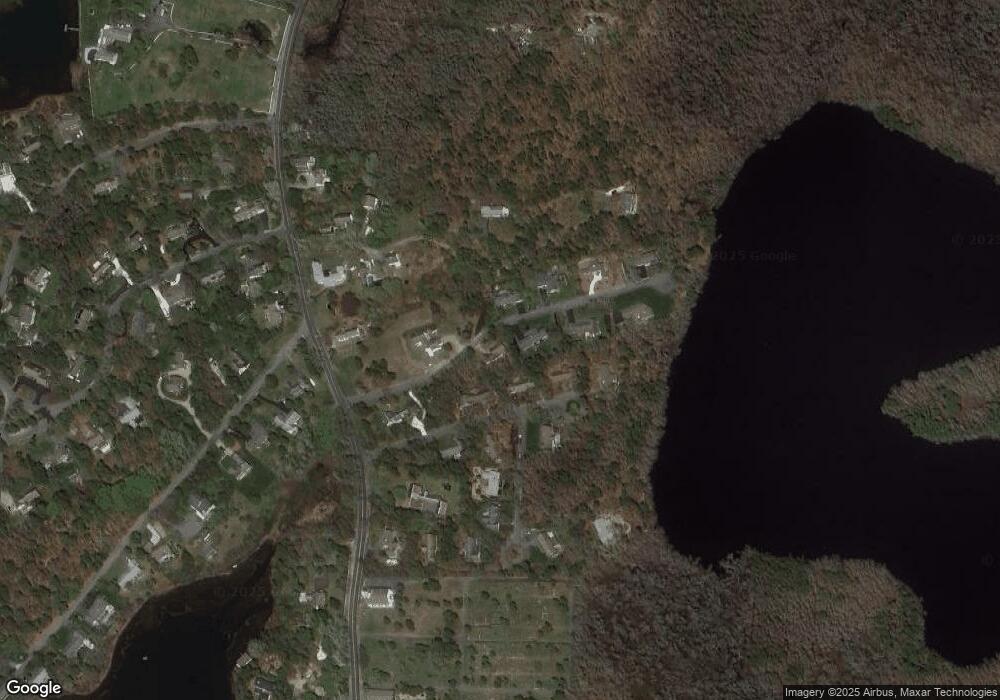
Map
Nearby Homes
- 293 Main St
- 293 Main St
- 295 Main St
- 15 Yenom Rd
- 3 Pinefield Ln
- 31 Duck Pond Rd
- 26 Center St
- 401 Main St Unit 201
- 401 Main St Unit 101
- 95 Center St
- 3 Jennifer Ln
- 29 Highland St
- 20 Aunt Debbys Rd
- 171 Searsville Rd
- 116 Searsville Rd
- 71 Main St
- 428 Main St Unit 1-11
- 125 Main St Unit 3
- 467 Main St
- 4 Coffey Ln
- 16 Fresh Pond Cir
- 22 Fresh Pond Cir
- 29 Hidden Shores Ln
- 14 Hidden Shores Ln
- 26 Hidden Shores Ln
- 3 Conifer Ln
- 28 Fresh Pond Cir
- 2 Conifer Ln
- 34 Hidden Shores Ln
- 35 Hidden Shores Ln
- 7 Fresh Pond Cir
- 258 Main St
- 258 Main St
- 32 Fresh Pond Cir
- 9 Conifer Ln
- 12 Winstons Path
- 3 Fresh Pond Cir
- 260 Main St
- 40 Hidden Shores Ln
- 270 Main St