21 Hillcrest St Ardmore, OK 73401
Estimated Value: $128,566 - $147,000
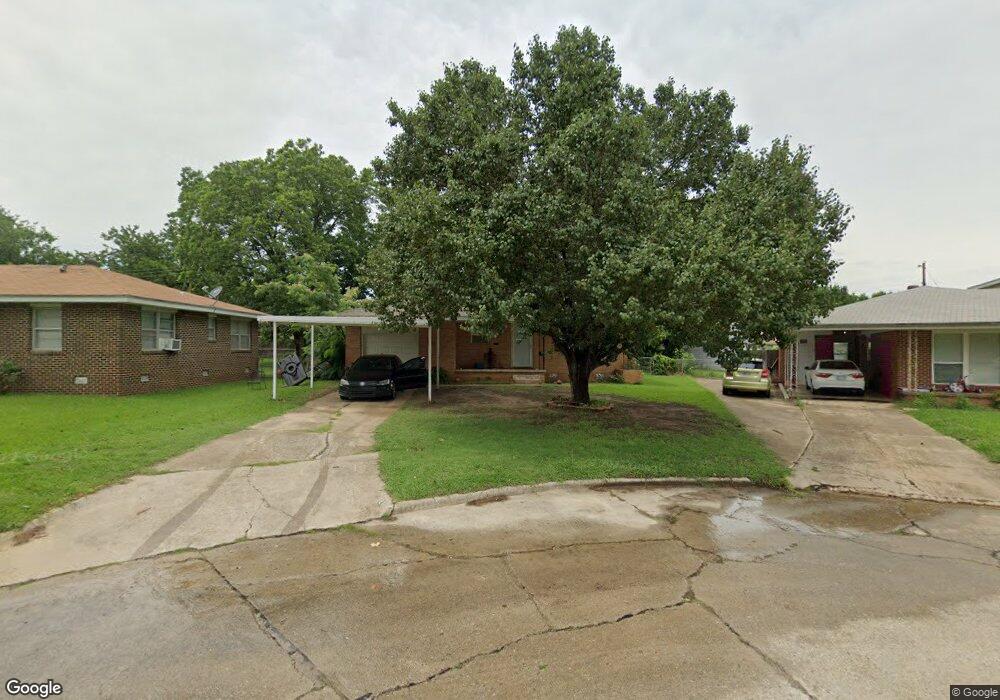
About This Home
This home is located at 21 Hillcrest St, Ardmore, OK 73401 and is currently estimated at $136,642, approximately $131 per square foot. 21 Hillcrest St is a home located in Carter County with nearby schools including Charles Evans Elementary School, Ardmore Middle School, and Ardmore High School.
Ownership History
We collect this data history from publicly available records. To have your information removed, we recommend requesting removal directly through your county’s website.
Purchase Details
Home Financials for this Owner
Home Financials are based on the most recent Mortgage that was taken out on this home.Purchase Details
Home Financials for this Owner
Home Financials are based on the most recent Mortgage that was taken out on this home.Purchase Details
Purchase Details
Purchase History
We collect this data history from publicly available records. To have your information removed, we recommend requesting removal directly through your county’s website.
| Date | Buyer | Sale Price | Title Company |
|---|---|---|---|
| $75,000 | -- | ||
| $83,000 | -- | ||
| $46,000 | -- | ||
| $35,500 | -- |
Mortgage History
We collect this data history from publicly available records. To have your information removed, we recommend requesting removal directly through your county’s website.
| Date | Status | Borrower | Loan Amount |
|---|---|---|---|
| Open | $73,659 | ||
| Previous Owner | $16,600 |
Tax History
We collect this data history from publicly available records. To have your information removed, we recommend requesting removal directly through your county’s website.
| Year | Tax Paid | Tax Assessment Tax Assessment Total Assessment is a certain percentage of the fair market value that is determined by local assessors to be the total taxable value of land and additions on the property. | Land | Improvement |
|---|---|---|---|---|
| 2025 | $697 | $7,987 | $820 | $7,167 |
| 2024 | $698 | $7,755 | $796 | $6,959 |
| 2023 | $674 | $7,529 | $761 | $6,768 |
| 2022 | $603 | $7,310 | $721 | $6,589 |
| 2021 | $615 | $7,098 | $683 | $6,415 |
| 2020 | $586 | $6,890 | $610 | $6,280 |
| 2019 | $552 | $6,690 | $864 | $5,826 |
| 2018 | $542 | $6,495 | $355 | $6,140 |
| 2017 | $485 | $6,306 | $355 | $5,951 |
| 2016 | $477 | $6,122 | $355 | $5,767 |
| 2015 | $380 | $5,944 | $355 | $5,589 |
| 2014 | $442 | $5,944 | $355 | $5,589 |
Map
- 20 15th Ave NW
- 45 15th Ave NW
- 1409 Mount Washington Rd
- 11 Turner St
- 1409 B St NW
- 1415 Holt St
- 111 Lost Creek Ln
- 1726 Downing St
- 116 11th Ave NW
- 412 Wandering Way
- 209 11th Ave NW
- 1750 Mount Washington Rd
- 1737 Winchester St
- 204 10th Ave NE
- 10 10th Ave NW
- 911 A St NE
- 908 B St NE
- 1736 Tiverton St
- 1740 Tiverton St
- 905 11th Ave NE
- 17 Hillcrest St
- 20 15th Ave NE
- 13 Hillcrest St
- 16 15th Ave NE
- 24 15th Ave NE
- 27 Hillcrest Ave NE
- 27 Hillcrest St
- 12 15th Ave NE
- 28 15th Ave NE
- 9 Hillcrest St
- 16 Hillcrest St
- 20 Hillcrest St
- 8 15th Ave NE
- 24 Hillcrest St
- 12 Hillcrest St
- 8 Hillcrest St
- 1452 N Washington St
- 1448 N Washington St
- 1456 N Washington St
- 19 15th Ave NE
Ask me questions while you tour the home.