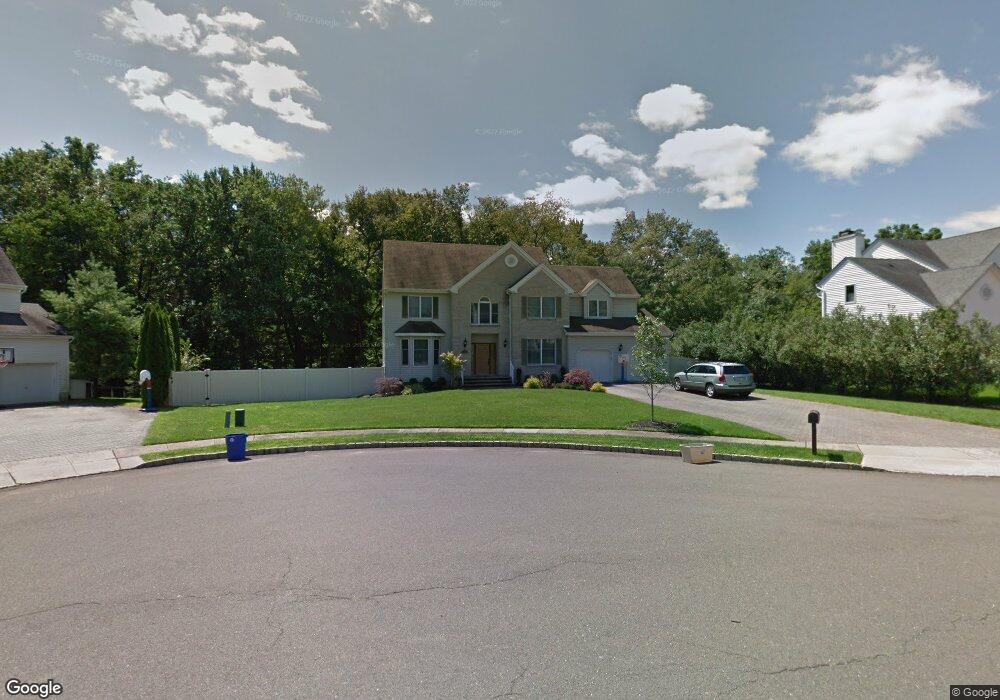
21 Hillside Dr East Hanover, NJ 07936
Estimated Value: $1,129,149 - $1,258,000
--
Bed
--
Bath
2,963
Sq Ft
$407/Sq Ft
Est. Value
About This Home
This home is located at 21 Hillside Dr, East Hanover, NJ 07936 and is currently estimated at $1,206,537, approximately $407 per square foot. 21 Hillside Dr is a home located in Morris County with nearby schools including Frank J. Smith Elementary School, Central Elementary School, and East Hanover Middle School.
Ownership History
Date
Name
Owned For
Owner Type
Purchase Details
Closed on
Aug 13, 2010
Sold by
Betman Fred S
Bought by
Chung Joseph and Chung Anna
Current Estimated Value
Home Financials for this Owner
Home Financials are based on the most recent Mortgage that was taken out on this home.
Original Mortgage
$592,000
Outstanding Balance
$393,146
Interest Rate
4.63%
Mortgage Type
New Conventional
Estimated Equity
$813,391
Purchase Details
Closed on
Sep 10, 2007
Sold by
Damgen Jeanne M
Bought by
Betman Fred S
Purchase Details
Closed on
Aug 21, 1997
Sold by
Afton Hills Estates Inc
Bought by
Betman Fred S and Damgen Jeanne M
Home Financials for this Owner
Home Financials are based on the most recent Mortgage that was taken out on this home.
Original Mortgage
$300,000
Interest Rate
7.36%
Create a Home Valuation Report for This Property
The Home Valuation Report is an in-depth analysis detailing your home's value as well as a comparison with similar homes in the area
Home Values in the Area
Average Home Value in this Area
Purchase History
| Date | Buyer | Sale Price | Title Company |
|---|---|---|---|
| Chung Joseph | $770,000 | None Available | |
| Betman Fred S | -- | None Available | |
| Betman Fred S | $379,900 | -- |
Source: Public Records
Mortgage History
| Date | Status | Borrower | Loan Amount |
|---|---|---|---|
| Open | Chung Joseph | $592,000 | |
| Previous Owner | Betman Fred S | $300,000 |
Source: Public Records
Tax History Compared to Growth
Tax History
| Year | Tax Paid | Tax Assessment Tax Assessment Total Assessment is a certain percentage of the fair market value that is determined by local assessors to be the total taxable value of land and additions on the property. | Land | Improvement |
|---|---|---|---|---|
| 2025 | $13,071 | $503,900 | $197,500 | $306,400 |
| 2024 | $12,572 | $503,900 | $197,500 | $306,400 |
| 2023 | $12,572 | $503,900 | $197,500 | $306,400 |
| 2022 | $12,285 | $503,900 | $197,500 | $306,400 |
| 2021 | $12,285 | $503,900 | $197,500 | $306,400 |
| 2020 | $12,043 | $503,900 | $197,500 | $306,400 |
| 2019 | $11,821 | $503,900 | $197,500 | $306,400 |
| 2018 | $11,464 | $503,900 | $197,500 | $306,400 |
| 2017 | $11,091 | $503,900 | $197,500 | $306,400 |
| 2016 | $10,940 | $503,900 | $197,500 | $306,400 |
| 2015 | $10,783 | $503,900 | $197,500 | $306,400 |
| 2014 | $10,552 | $503,900 | $197,500 | $306,400 |
Source: Public Records
Map
Nearby Homes
- 32 Ridge Dr
- 50 River Rd
- 16 Claire Ct
- 60 Baker Rd
- 29 Beach St
- 4 Justin Dr
- 46 Eastwood Terrace Unit 55
- 7 Eastwood Terrace
- 71 Tiffany Dr
- Birch Plan at Valley View Park - The Signature Collection
- Pershing Plan at Valley View Park - The Pershing Collection
- Monterey Plan at Valley View Park - The Monterey Collection
- Maple Plan at Valley View Park - The Signature Collection
- 250 Ridgedale Ave Unit 8
- 22 Valley View Dr
- 83 Ventura Dr Unit 67
- 68 Eastwood Terrace
- 4 Eastwood Terrace
- 65 Eastwood Terrace
- 67 Eastwood Terrace