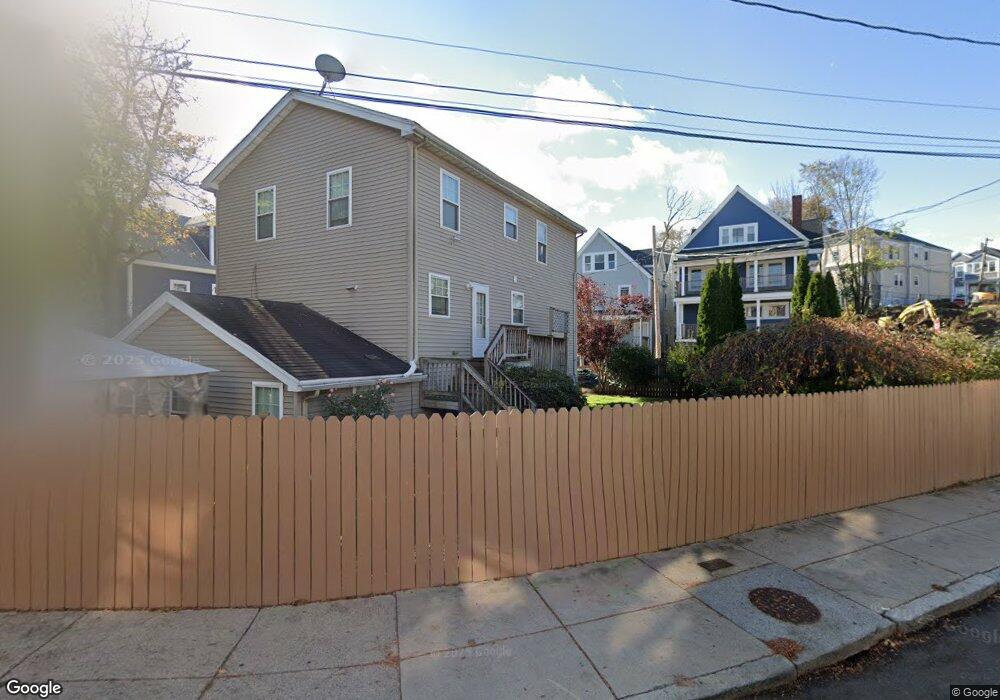
21 Holborn St Dorchester, MA 02121
Sav-Mor NeighborhoodEstimated Value: $763,000 - $1,153,055
6
Beds
4
Baths
2,824
Sq Ft
$342/Sq Ft
Est. Value
About This Home
This home is located at 21 Holborn St, Dorchester, MA 02121 and is currently estimated at $965,014, approximately $341 per square foot. 21 Holborn St is a home located in Suffolk County with nearby schools including Bridge Boston Charter School and Uncommon Schools Roxbury Prep Dorchester Campus.
Ownership History
Date
Name
Owned For
Owner Type
Purchase Details
Closed on
Jan 18, 2005
Sold by
Jackson Hawah and King Marlon
Bought by
Jackson Hawah
Current Estimated Value
Purchase Details
Closed on
Dec 28, 2001
Sold by
Chandler Sonya Y
Bought by
Larosa Dev Corp
Purchase Details
Closed on
Mar 30, 1992
Sold by
T & M Rt
Bought by
Biondo Co Inc
Create a Home Valuation Report for This Property
The Home Valuation Report is an in-depth analysis detailing your home's value as well as a comparison with similar homes in the area
Home Values in the Area
Average Home Value in this Area
Purchase History
| Date | Buyer | Sale Price | Title Company |
|---|---|---|---|
| Jackson Hawah | -- | -- | |
| Larosa Dev Corp | $65,000 | -- | |
| Biondo Co Inc | $18,000 | -- |
Source: Public Records
Mortgage History
| Date | Status | Borrower | Loan Amount |
|---|---|---|---|
| Previous Owner | Biondo Co Inc | $21,750 |
Source: Public Records
Tax History Compared to Growth
Tax History
| Year | Tax Paid | Tax Assessment Tax Assessment Total Assessment is a certain percentage of the fair market value that is determined by local assessors to be the total taxable value of land and additions on the property. | Land | Improvement |
|---|---|---|---|---|
| 2025 | $11,431 | $987,100 | $279,100 | $708,000 |
| 2024 | $10,653 | $977,300 | $227,300 | $750,000 |
| 2023 | $9,811 | $913,500 | $212,400 | $701,100 |
| 2022 | $9,035 | $830,400 | $193,100 | $637,300 |
| 2021 | $8,204 | $768,900 | $178,800 | $590,100 |
| 2020 | $6,235 | $590,400 | $158,200 | $432,200 |
| 2019 | $5,811 | $551,300 | $123,500 | $427,800 |
| 2018 | $5,348 | $510,300 | $123,500 | $386,800 |
| 2017 | $5,404 | $510,300 | $123,500 | $386,800 |
| 2016 | $5,012 | $455,600 | $123,500 | $332,100 |
| 2015 | $4,450 | $367,500 | $99,900 | $267,600 |
| 2014 | $4,319 | $343,300 | $99,900 | $243,400 |
Source: Public Records
Map
Nearby Homes
- 476 Warren St
- 472 Warren St
- 495 Warren St
- 36-38 Elm Hill Park
- 4 Wyoming St Unit 2
- 2 Otisfield St
- 7 Waumbeck St Unit 3
- 16 Wabon St
- 28 Wabon St
- 52 Intervale St
- 40 Devon St Unit 3
- 31 Dewey St
- 194 Blue Hill Ave
- 8 Adrian St
- 28 Woodbine St
- 175 Howard Ave Unit 2
- 63 Normandy St
- 99 Harrishof St
- 164 Ruthven St Unit 1
- 151 Townsend St
- 21 Holborn St Unit 1
- 23 Holborn St
- 17 Holborn St
- 6 Gannett St
- 6 Gannett St Unit 2
- 6 Gannett St Unit 1
- 6 Gannett St
- 25 Holborn St
- 25 Holborn St
- 8 Gannett St
- 2 Holborn Park
- 24 Holborn St Unit 3B
- 24-26 Holborn St Unit 3A
- 24 Holborn St Unit 26
- 24 Holborn St Unit 26
- 24 Holborn St Unit 26
- 24 Holborn St Unit 26
- 24 Holborn St Unit 26
- 24 Holborn St Unit 26
- 24-26 Holborn St Unit 2A