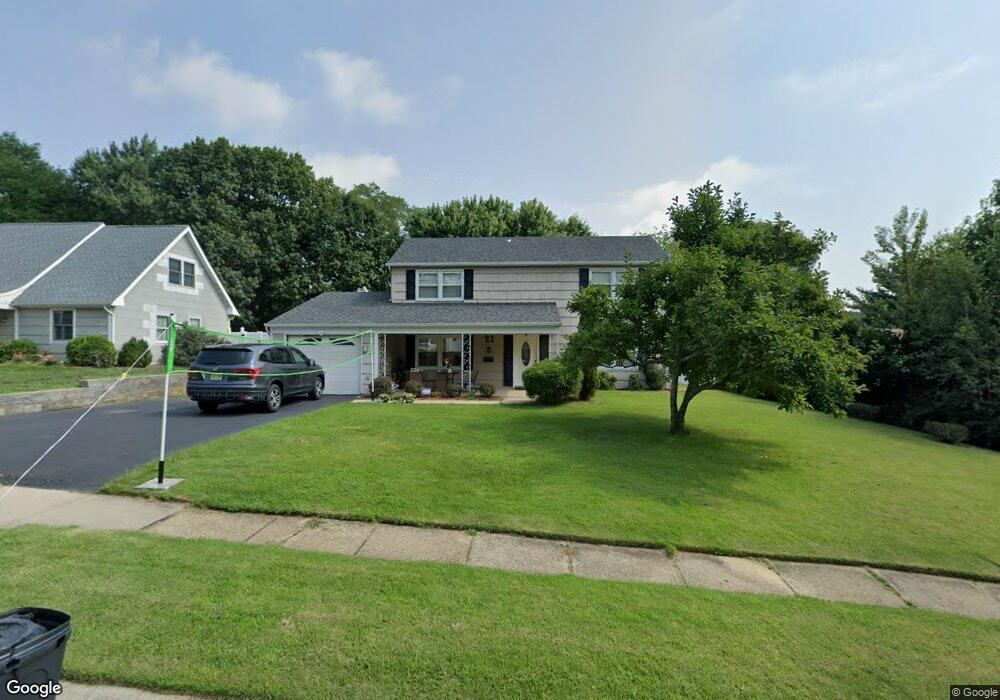
21 Infield Ln Matawan, NJ 07747
Estimated Value: $730,000 - $771,114
3
Beds
3
Baths
2,112
Sq Ft
$351/Sq Ft
Est. Value
About This Home
This home is located at 21 Infield Ln, Matawan, NJ 07747 and is currently estimated at $742,279, approximately $351 per square foot. 21 Infield Ln is a home located in Monmouth County with nearby schools including Matawan Reg High School, St Benedict School, and St. Joseph Elementary School.
Ownership History
Date
Name
Owned For
Owner Type
Purchase Details
Closed on
Sep 30, 2005
Sold by
Mohamed Rashad Abdelkarim
Bought by
Seldura Efren and Vasquez Sandee
Current Estimated Value
Home Financials for this Owner
Home Financials are based on the most recent Mortgage that was taken out on this home.
Original Mortgage
$292,000
Interest Rate
6.07%
Mortgage Type
New Conventional
Purchase Details
Closed on
Sep 18, 2003
Sold by
Tiu Narciso
Bought by
Neve Ibrahim and Abdelkarim Mohamed
Create a Home Valuation Report for This Property
The Home Valuation Report is an in-depth analysis detailing your home's value as well as a comparison with similar homes in the area
Home Values in the Area
Average Home Value in this Area
Purchase History
| Date | Buyer | Sale Price | Title Company |
|---|---|---|---|
| Seldura Efren | $410,000 | -- | |
| Neve Ibrahim | $334,900 | -- |
Source: Public Records
Mortgage History
| Date | Status | Borrower | Loan Amount |
|---|---|---|---|
| Previous Owner | Seldura Efren | $292,000 |
Source: Public Records
Tax History Compared to Growth
Tax History
| Year | Tax Paid | Tax Assessment Tax Assessment Total Assessment is a certain percentage of the fair market value that is determined by local assessors to be the total taxable value of land and additions on the property. | Land | Improvement |
|---|---|---|---|---|
| 2025 | $12,678 | $700,700 | $435,500 | $265,200 |
| 2024 | $12,252 | $627,300 | $367,000 | $260,300 |
| 2023 | $12,252 | $572,800 | $318,500 | $254,300 |
| 2022 | $11,466 | $472,800 | $248,000 | $224,800 |
| 2021 | $11,466 | $424,200 | $224,200 | $200,000 |
| 2020 | $11,662 | $429,700 | $234,200 | $195,500 |
| 2019 | $11,581 | $414,500 | $220,200 | $194,300 |
| 2018 | $11,064 | $397,000 | $211,700 | $185,300 |
| 2017 | $10,591 | $385,400 | $191,700 | $193,700 |
| 2016 | $9,861 | $374,500 | $185,700 | $188,800 |
| 2015 | $10,119 | $368,900 | $192,700 | $176,200 |
| 2014 | $9,646 | $358,600 | $183,700 | $174,900 |
Source: Public Records
Map
Nearby Homes
- 9 Idolstone Ln
- 13 Ivy Hill Dr
- 106 van Brackle Rd
- 129 Dumbarton Hill Ct
- 108 Dundee Ct
- 141 Eastwick Ct Unit 141
- 75 Bradford Ct Unit 75
- 68 Bradford Ct
- 184 Edinburgh Ct Unit 184
- 31 Balmoral Ct
- 223 Perth Hill Ct Unit 223
- 2 Avondale Ln
- 315 Wellington Place
- 304 Wellington Place
- 3 Tolas Dr
- 3 Avondale Ln
- 9 Jubilee Cir
- 704 Wellington Place
- 702 Wellington Place Unit 2
- 702 Wellington Place Unit 702