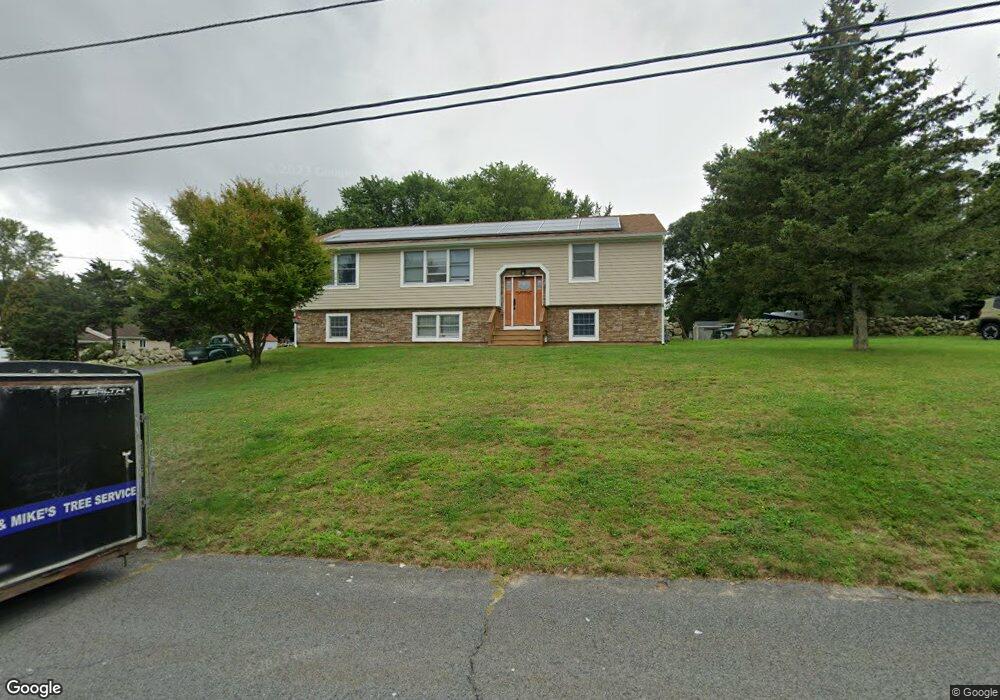
21 Irene Dr Westport, MA 02790
Estimated Value: $522,268 - $607,000
3
Beds
--
Bath
1,456
Sq Ft
$391/Sq Ft
Est. Value
About This Home
This home is located at 21 Irene Dr, Westport, MA 02790 and is currently estimated at $569,089, approximately $390 per square foot. 21 Irene Dr is a home located in Bristol County with nearby schools including Alice A. Macomber Primary School, Westport Elementary School, and Westport Middle-High School.
Ownership History
Date
Name
Owned For
Owner Type
Purchase Details
Closed on
Jan 11, 2022
Sold by
Denadal John W and Denadal Katherine M
Bought by
Denadal John W and Denadal Katherine M
Current Estimated Value
Purchase Details
Closed on
Apr 26, 2007
Sold by
Denadal Cecile E and Denadal Paul J
Bought by
Denadal John W and Nguyen Katherine M
Home Financials for this Owner
Home Financials are based on the most recent Mortgage that was taken out on this home.
Original Mortgage
$250,000
Interest Rate
6.18%
Mortgage Type
Purchase Money Mortgage
Create a Home Valuation Report for This Property
The Home Valuation Report is an in-depth analysis detailing your home's value as well as a comparison with similar homes in the area
Home Values in the Area
Average Home Value in this Area
Purchase History
| Date | Buyer | Sale Price | Title Company |
|---|---|---|---|
| Denadal John W | -- | None Available | |
| Denadal John W | $313,000 | -- |
Source: Public Records
Mortgage History
| Date | Status | Borrower | Loan Amount |
|---|---|---|---|
| Previous Owner | Denadal John W | $240,000 | |
| Previous Owner | Denadal John W | $246,000 | |
| Previous Owner | Denadal John W | $250,000 |
Source: Public Records
Tax History Compared to Growth
Tax History
| Year | Tax Paid | Tax Assessment Tax Assessment Total Assessment is a certain percentage of the fair market value that is determined by local assessors to be the total taxable value of land and additions on the property. | Land | Improvement |
|---|---|---|---|---|
| 2025 | $3,116 | $418,200 | $170,900 | $247,300 |
| 2024 | $3,107 | $402,000 | $158,300 | $243,700 |
| 2023 | $2,916 | $357,300 | $144,200 | $213,100 |
| 2022 | $2,791 | $329,100 | $131,100 | $198,000 |
| 2021 | $2,657 | $308,200 | $119,200 | $189,000 |
| 2020 | $2,558 | $303,400 | $114,400 | $189,000 |
| 2019 | $2,432 | $294,100 | $114,400 | $179,700 |
| 2018 | $2,357 | $288,500 | $114,300 | $174,200 |
| 2017 | $2,169 | $272,200 | $110,700 | $161,500 |
| 2016 | $2,025 | $256,000 | $107,000 | $149,000 |
| 2015 | $2,051 | $258,700 | $109,400 | $149,300 |
Source: Public Records
Map
Nearby Homes