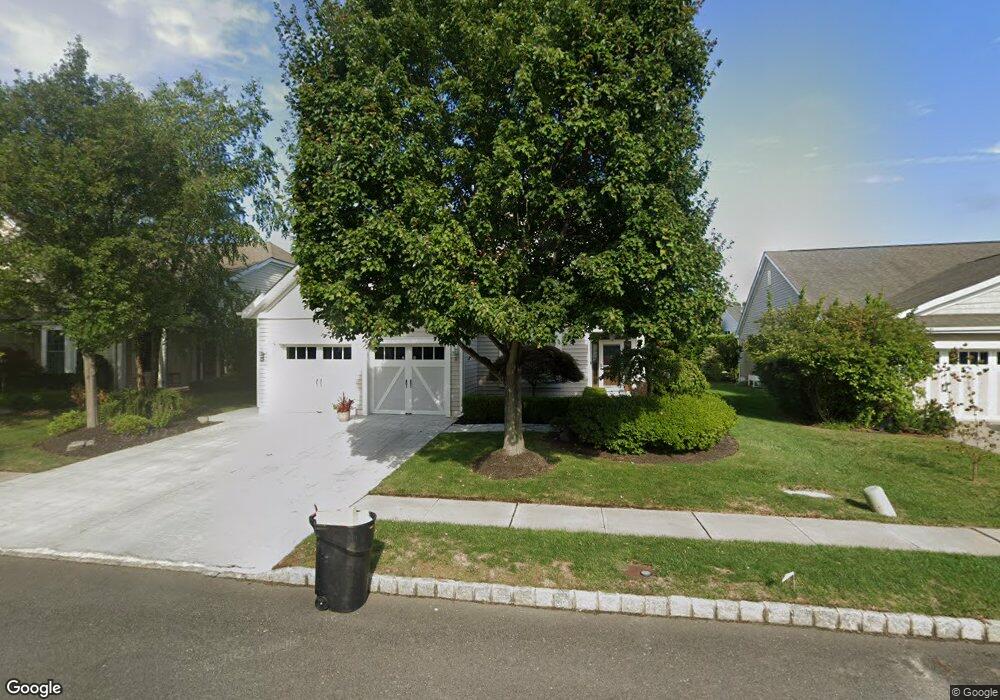
21 Iselin Ln Oceanport, NJ 07757
Estimated Value: $1,100,000 - $1,288,000
3
Beds
2
Baths
3,430
Sq Ft
$354/Sq Ft
Est. Value
About This Home
This home is located at 21 Iselin Ln, Oceanport, NJ 07757 and is currently estimated at $1,215,332, approximately $354 per square foot. 21 Iselin Ln is a home located in Monmouth County with nearby schools including Wolf Hill Elementary School, Maple Place Elementary and Middle School, and Shore Regional High School.
Ownership History
Date
Name
Owned For
Owner Type
Purchase Details
Closed on
Apr 10, 2023
Sold by
Williams Paul A and Littlefield Kimberly F
Bought by
Littlefield Williams Irrevocable Trust and Nemeth
Current Estimated Value
Purchase Details
Closed on
Jul 25, 2008
Sold by
K Hovnanian At Oceanport Llc
Bought by
Williams Paul A and Littlefield Kimberly A
Home Financials for this Owner
Home Financials are based on the most recent Mortgage that was taken out on this home.
Original Mortgage
$400,000
Interest Rate
6.35%
Mortgage Type
Purchase Money Mortgage
Create a Home Valuation Report for This Property
The Home Valuation Report is an in-depth analysis detailing your home's value as well as a comparison with similar homes in the area
Home Values in the Area
Average Home Value in this Area
Purchase History
| Date | Buyer | Sale Price | Title Company |
|---|---|---|---|
| Littlefield Williams Irrevocable Trust | -- | None Listed On Document | |
| Williams Paul A | $712,123 | None Available |
Source: Public Records
Mortgage History
| Date | Status | Borrower | Loan Amount |
|---|---|---|---|
| Previous Owner | Williams Paul A | $400,000 |
Source: Public Records
Tax History Compared to Growth
Tax History
| Year | Tax Paid | Tax Assessment Tax Assessment Total Assessment is a certain percentage of the fair market value that is determined by local assessors to be the total taxable value of land and additions on the property. | Land | Improvement |
|---|---|---|---|---|
| 2025 | $15,594 | $1,027,100 | $420,200 | $606,900 |
| 2024 | $15,637 | $987,600 | $400,200 | $587,400 |
| 2023 | $15,637 | $939,700 | $375,200 | $564,500 |
| 2022 | $14,701 | $822,900 | $320,200 | $502,700 |
| 2021 | $14,701 | $771,700 | $288,200 | $483,500 |
| 2020 | $13,633 | $745,800 | $265,200 | $480,600 |
| 2019 | $13,223 | $734,200 | $265,200 | $469,000 |
| 2018 | $13,124 | $733,600 | $265,200 | $468,400 |
| 2017 | $13,744 | $637,200 | $225,200 | $412,000 |
| 2016 | $13,591 | $634,200 | $225,200 | $409,000 |
| 2015 | $13,033 | $628,400 | $225,200 | $403,200 |
| 2014 | $12,006 | $587,100 | $225,200 | $361,900 |
Source: Public Records
Map
Nearby Homes