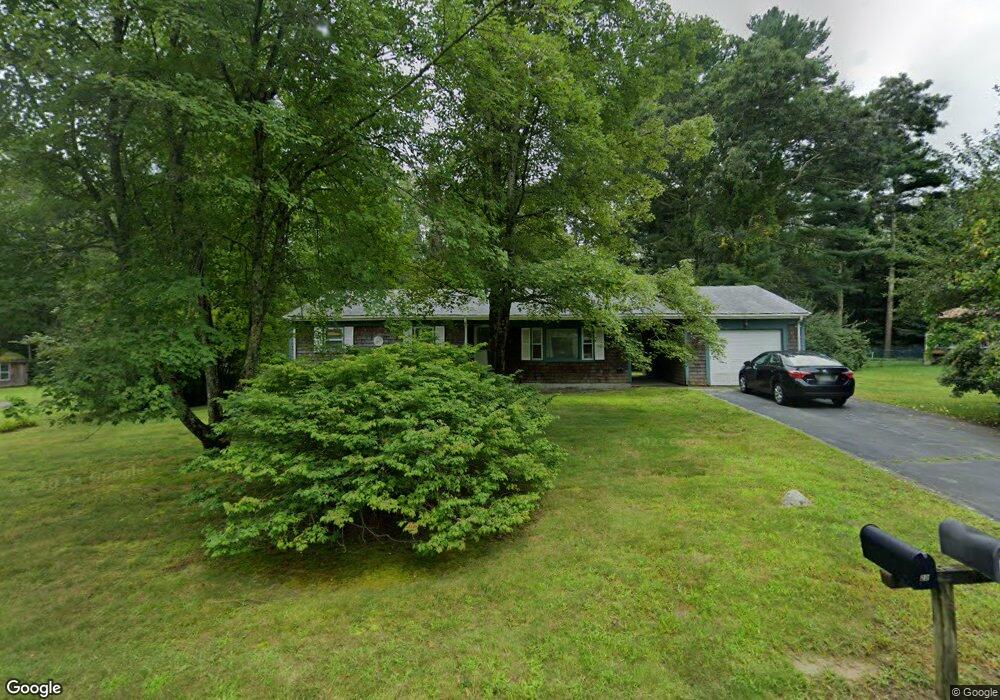
21 James Ave Westport, MA 02790
North Westport NeighborhoodEstimated Value: $448,000 - $551,000
3
Beds
--
Bath
1,152
Sq Ft
$417/Sq Ft
Est. Value
About This Home
This home is located at 21 James Ave, Westport, MA 02790 and is currently estimated at $480,862, approximately $417 per square foot. 21 James Ave is a home located in Bristol County with nearby schools including Alice A. Macomber Primary School, Westport Elementary School, and Westport Middle-High School.
Ownership History
Date
Name
Owned For
Owner Type
Purchase Details
Closed on
Mar 5, 1999
Sold by
Robertson Clarence
Bought by
Robertson Carol A
Current Estimated Value
Home Financials for this Owner
Home Financials are based on the most recent Mortgage that was taken out on this home.
Original Mortgage
$60,000
Outstanding Balance
$14,534
Interest Rate
6.76%
Mortgage Type
Purchase Money Mortgage
Estimated Equity
$466,328
Create a Home Valuation Report for This Property
The Home Valuation Report is an in-depth analysis detailing your home's value as well as a comparison with similar homes in the area
Home Values in the Area
Average Home Value in this Area
Purchase History
| Date | Buyer | Sale Price | Title Company |
|---|---|---|---|
| Robertson Carol A | $50,000 | -- |
Source: Public Records
Mortgage History
| Date | Status | Borrower | Loan Amount |
|---|---|---|---|
| Open | Robertson Carol A | $60,000 |
Source: Public Records
Tax History Compared to Growth
Tax History
| Year | Tax Paid | Tax Assessment Tax Assessment Total Assessment is a certain percentage of the fair market value that is determined by local assessors to be the total taxable value of land and additions on the property. | Land | Improvement |
|---|---|---|---|---|
| 2025 | $2,780 | $373,200 | $162,100 | $211,100 |
| 2024 | $2,771 | $358,500 | $150,200 | $208,300 |
| 2023 | $2,671 | $327,300 | $136,800 | $190,500 |
| 2022 | $2,318 | $292,800 | $124,400 | $168,400 |
| 2021 | $3,795 | $268,900 | $113,100 | $155,800 |
| 2020 | $3,775 | $264,400 | $108,600 | $155,800 |
| 2019 | $2,161 | $261,300 | $108,600 | $152,700 |
| 2018 | $2,011 | $246,100 | $109,700 | $136,400 |
| 2017 | $2,957 | $239,700 | $106,200 | $133,500 |
| 2016 | $1,769 | $223,600 | $102,700 | $120,900 |
| 2015 | $1,684 | $212,300 | $105,100 | $107,200 |
Source: Public Records
Map
Nearby Homes