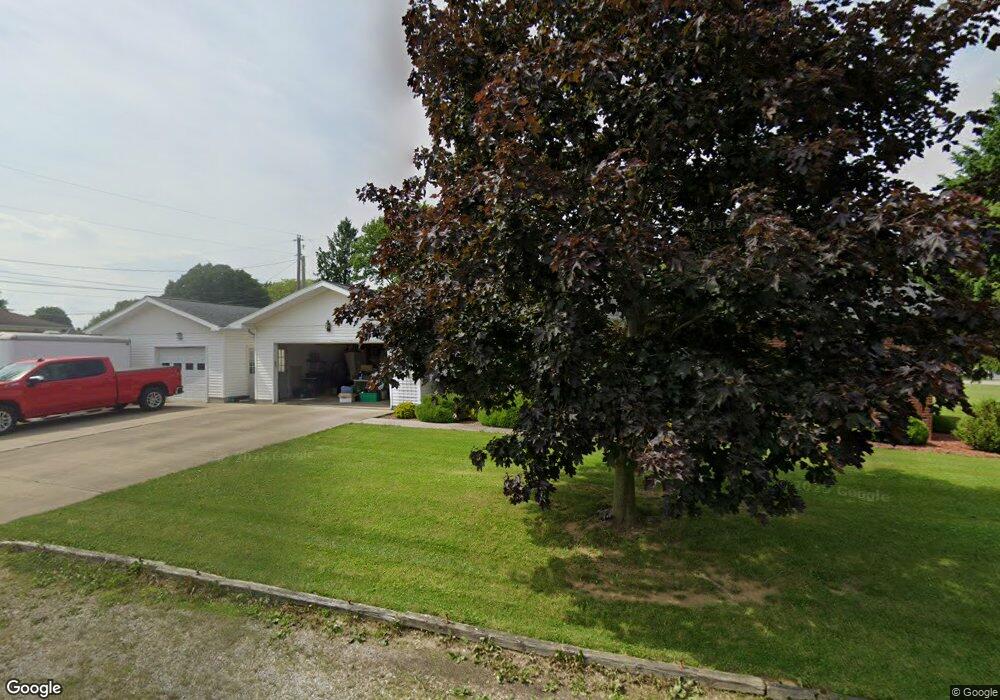
21 Jayne Ave Shelby, OH 44875
Estimated Value: $200,000 - $260,000
3
Beds
3
Baths
1,496
Sq Ft
$153/Sq Ft
Est. Value
About This Home
This home is located at 21 Jayne Ave, Shelby, OH 44875 and is currently estimated at $229,538, approximately $153 per square foot. 21 Jayne Ave is a home located in Richland County with nearby schools including St. Mary's School and Sacred Heart School.
Ownership History
Date
Name
Owned For
Owner Type
Purchase Details
Closed on
Jul 28, 2025
Sold by
Moore Krista A
Bought by
Moore David E
Current Estimated Value
Purchase Details
Closed on
Mar 14, 2000
Sold by
Pohlabel Robert L
Bought by
Moore David E and Moore Krista A
Home Financials for this Owner
Home Financials are based on the most recent Mortgage that was taken out on this home.
Original Mortgage
$108,350
Interest Rate
8.26%
Mortgage Type
New Conventional
Purchase Details
Closed on
Sep 18, 1991
Sold by
Wentworth Paul T
Bought by
Pohlabel Robert L
Purchase Details
Closed on
Jan 1, 1990
Create a Home Valuation Report for This Property
The Home Valuation Report is an in-depth analysis detailing your home's value as well as a comparison with similar homes in the area
Home Values in the Area
Average Home Value in this Area
Purchase History
| Date | Buyer | Sale Price | Title Company |
|---|---|---|---|
| Moore David E | -- | None Listed On Document | |
| Moore David E | $107,500 | -- | |
| Pohlabel Robert L | $72,000 | -- | |
| -- | $74,000 | -- |
Source: Public Records
Mortgage History
| Date | Status | Borrower | Loan Amount |
|---|---|---|---|
| Previous Owner | Moore David E | $108,350 |
Source: Public Records
Tax History Compared to Growth
Tax History
| Year | Tax Paid | Tax Assessment Tax Assessment Total Assessment is a certain percentage of the fair market value that is determined by local assessors to be the total taxable value of land and additions on the property. | Land | Improvement |
|---|---|---|---|---|
| 2024 | $2,344 | $59,840 | $7,050 | $52,790 |
| 2023 | $2,344 | $59,840 | $7,050 | $52,790 |
| 2022 | $2,193 | $50,090 | $6,200 | $43,890 |
| 2021 | $2,194 | $50,090 | $6,200 | $43,890 |
| 2020 | $2,196 | $50,090 | $6,200 | $43,890 |
| 2019 | $2,043 | $42,750 | $5,250 | $37,500 |
| 2018 | $2,024 | $42,750 | $5,250 | $37,500 |
| 2017 | $2,006 | $42,750 | $5,250 | $37,500 |
| 2016 | $2,129 | $45,670 | $5,250 | $40,420 |
| 2015 | $2,119 | $45,670 | $5,250 | $40,420 |
| 2014 | $2,047 | $45,670 | $5,250 | $40,420 |
| 2012 | $2,004 | $45,670 | $5,250 | $40,420 |
Source: Public Records
Map
Nearby Homes