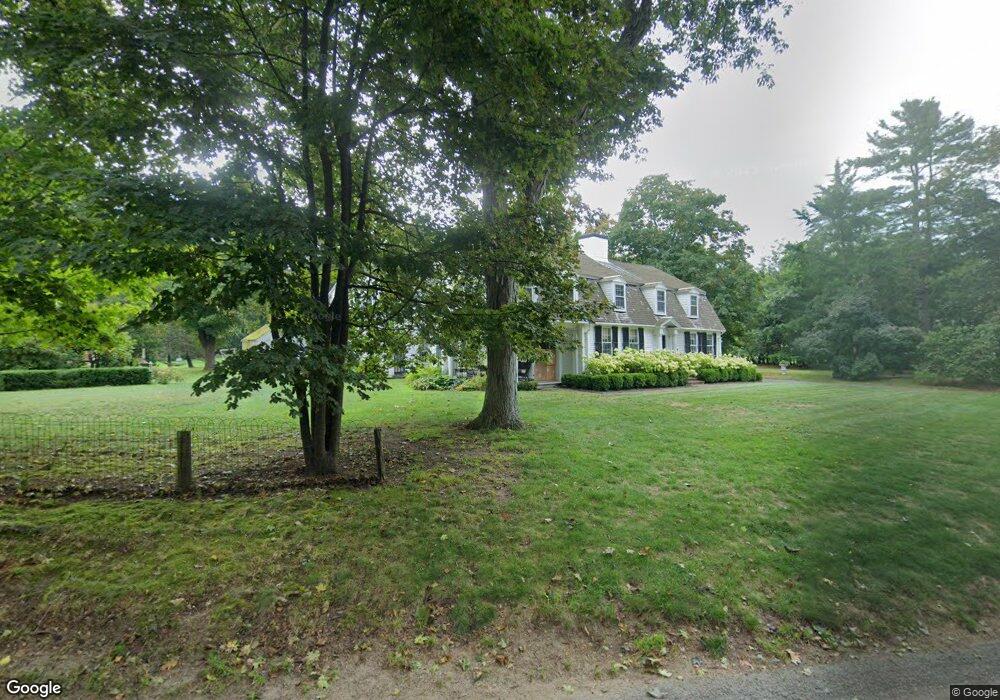
21 Jones St Hingham, MA 02043
Estimated Value: $834,478 - $1,219,000
3
Beds
1
Bath
1,332
Sq Ft
$729/Sq Ft
Est. Value
About This Home
This home is located at 21 Jones St, Hingham, MA 02043 and is currently estimated at $971,370, approximately $729 per square foot. 21 Jones St is a home located in Plymouth County with nearby schools including East Elementary School, Hingham Middle School, and Hingham High School.
Ownership History
Date
Name
Owned For
Owner Type
Purchase Details
Closed on
Sep 24, 2018
Sold by
Figueiredo Frances M and Fernald Daniel
Bought by
Jones Street Ret
Current Estimated Value
Purchase Details
Closed on
Apr 28, 2016
Sold by
Figueiredo Frances M
Bought by
Figueredo Frances D and Fernald Brian
Create a Home Valuation Report for This Property
The Home Valuation Report is an in-depth analysis detailing your home's value as well as a comparison with similar homes in the area
Purchase History
| Date | Buyer | Sale Price | Title Company |
|---|---|---|---|
| Jones Street Ret | -- | -- | |
| Figueredo Frances D | -- | -- |
Source: Public Records
Tax History
| Year | Tax Paid | Tax Assessment Tax Assessment Total Assessment is a certain percentage of the fair market value that is determined by local assessors to be the total taxable value of land and additions on the property. | Land | Improvement |
|---|---|---|---|---|
| 2025 | $7,933 | $742,100 | $464,600 | $277,500 |
| 2024 | $7,724 | $711,900 | $464,600 | $247,300 |
| 2023 | $7,107 | $710,700 | $464,600 | $246,100 |
| 2022 | $6,464 | $559,200 | $358,600 | $200,600 |
| 2021 | $6,335 | $536,900 | $358,600 | $178,300 |
| 2020 | $6,190 | $536,900 | $358,600 | $178,300 |
| 2019 | $6,158 | $521,400 | $358,600 | $162,800 |
| 2018 | $6,100 | $518,300 | $358,600 | $159,700 |
| 2017 | $6,357 | $518,900 | $366,700 | $152,200 |
| 2016 | $6,264 | $501,500 | $349,300 | $152,200 |
| 2015 | $6,075 | $484,800 | $332,600 | $152,200 |
Source: Public Records
Map
Nearby Homes
Your Personal Tour Guide
Ask me questions while you tour the home.