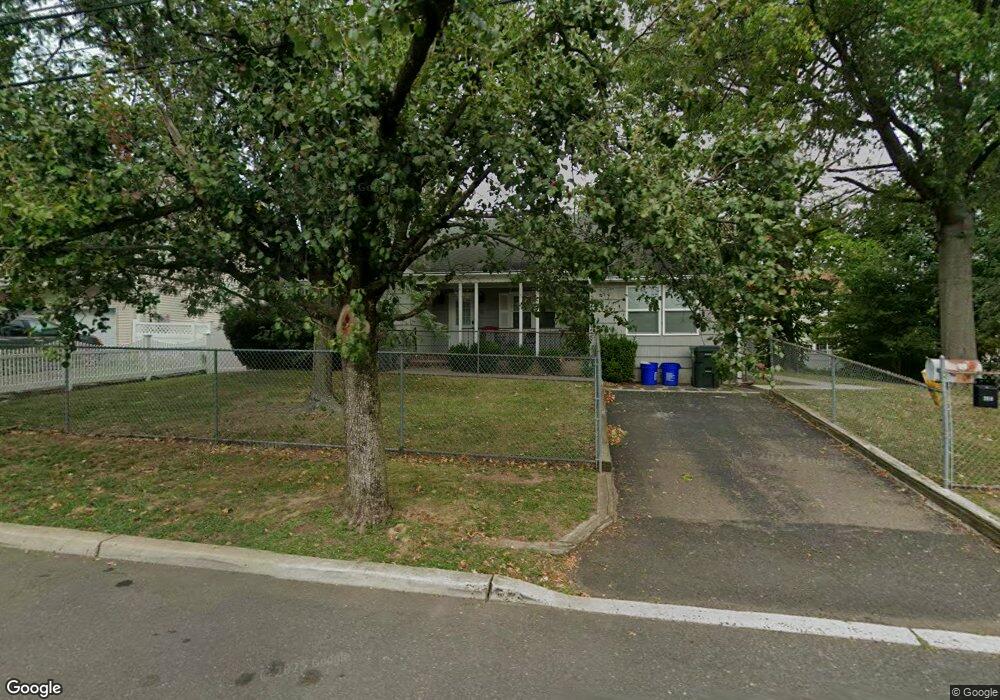
21 Kassul Place Somerset, NJ 08873
Estimated Value: $591,000 - $666,656
--
Bed
--
Bath
2,403
Sq Ft
$267/Sq Ft
Est. Value
About This Home
This home is located at 21 Kassul Place, Somerset, NJ 08873 and is currently estimated at $640,414, approximately $266 per square foot. 21 Kassul Place is a home located in Somerset County with nearby schools including Franklin High School and Central Jersey College Prep Charter School.
Ownership History
Date
Name
Owned For
Owner Type
Purchase Details
Closed on
May 25, 2022
Sold by
Howard Elsie R
Bought by
Boakye Benjamin
Current Estimated Value
Home Financials for this Owner
Home Financials are based on the most recent Mortgage that was taken out on this home.
Original Mortgage
$540,038
Outstanding Balance
$513,024
Interest Rate
5.25%
Mortgage Type
FHA
Estimated Equity
$127,390
Purchase Details
Closed on
Jan 25, 2005
Sold by
A Beverly Built Home Inc
Bought by
Howard Elsie R
Home Financials for this Owner
Home Financials are based on the most recent Mortgage that was taken out on this home.
Original Mortgage
$292,000
Interest Rate
6.12%
Mortgage Type
New Conventional
Purchase Details
Closed on
Aug 9, 2004
Sold by
Dunaenko Charles
Bought by
A Beverly Built Home Inc
Create a Home Valuation Report for This Property
The Home Valuation Report is an in-depth analysis detailing your home's value as well as a comparison with similar homes in the area
Home Values in the Area
Average Home Value in this Area
Purchase History
| Date | Buyer | Sale Price | Title Company |
|---|---|---|---|
| Boakye Benjamin | $550,000 | Commonwealth Land Title | |
| Howard Elsie R | $365,000 | -- | |
| A Beverly Built Home Inc | $275,000 | -- |
Source: Public Records
Mortgage History
| Date | Status | Borrower | Loan Amount |
|---|---|---|---|
| Open | Boakye Benjamin | $540,038 | |
| Previous Owner | Howard Elsie R | $292,000 |
Source: Public Records
Tax History Compared to Growth
Tax History
| Year | Tax Paid | Tax Assessment Tax Assessment Total Assessment is a certain percentage of the fair market value that is determined by local assessors to be the total taxable value of land and additions on the property. | Land | Improvement |
|---|---|---|---|---|
| 2025 | $7,472 | $463,400 | $199,600 | $263,800 |
| 2024 | $7,472 | $410,100 | $229,600 | $180,500 |
| 2023 | $7,281 | $375,300 | $194,800 | $180,500 |
| 2022 | $7,277 | $355,300 | $174,800 | $180,500 |
| 2021 | $7,028 | $315,300 | $134,800 | $180,500 |
| 2020 | $7,097 | $310,300 | $129,800 | $180,500 |
| 2019 | $7,077 | $305,300 | $124,800 | $180,500 |
| 2018 | $6,565 | $280,300 | $99,800 | $180,500 |
| 2017 | $6,355 | $270,300 | $89,800 | $180,500 |
| 2016 | $6,456 | $272,300 | $91,800 | $180,500 |
| 2015 | $6,436 | $273,300 | $92,800 | $180,500 |
| 2014 | $6,364 | $274,300 | $93,800 | $180,500 |
Source: Public Records
Map
Nearby Homes