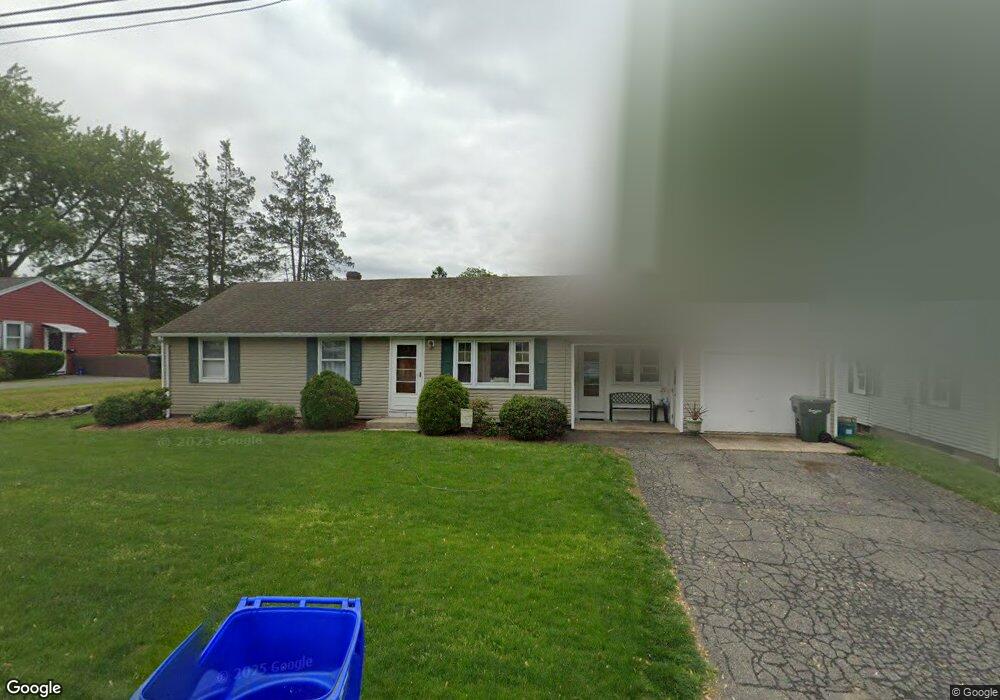
21 Kay St Springfield, MA 01109
Pine Point NeighborhoodEstimated Value: $272,572 - $333,000
3
Beds
1
Bath
1,152
Sq Ft
$263/Sq Ft
Est. Value
About This Home
This home is located at 21 Kay St, Springfield, MA 01109 and is currently estimated at $303,143, approximately $263 per square foot. 21 Kay St is a home located in Hampden County with nearby schools including Frank H. Freedman School, John J Duggan Middle, and Springfield Central High School.
Ownership History
Date
Name
Owned For
Owner Type
Purchase Details
Closed on
Jun 9, 2022
Sold by
Beeman Todd R and Beeman Tracy A
Bought by
Beeman Todd R
Current Estimated Value
Purchase Details
Closed on
Feb 2, 1993
Sold by
Moore Thomas A and Carlin Catherine
Bought by
Beeman Todd R and Beeman Tracy A
Create a Home Valuation Report for This Property
The Home Valuation Report is an in-depth analysis detailing your home's value as well as a comparison with similar homes in the area
Home Values in the Area
Average Home Value in this Area
Purchase History
| Date | Buyer | Sale Price | Title Company |
|---|---|---|---|
| Beeman Todd R | -- | None Available | |
| Beeman Todd R | $76,000 | -- |
Source: Public Records
Mortgage History
| Date | Status | Borrower | Loan Amount |
|---|---|---|---|
| Previous Owner | Beeman Todd R | $69,500 | |
| Previous Owner | Beeman Todd R | $15,300 | |
| Previous Owner | Beeman Todd R | $17,000 | |
| Previous Owner | Beeman Todd R | $60,000 |
Source: Public Records
Tax History
| Year | Tax Paid | Tax Assessment Tax Assessment Total Assessment is a certain percentage of the fair market value that is determined by local assessors to be the total taxable value of land and additions on the property. | Land | Improvement |
|---|---|---|---|---|
| 2025 | $3,983 | $254,000 | $40,800 | $213,200 |
| 2024 | $3,432 | $213,700 | $34,000 | $179,700 |
| 2023 | $3,417 | $200,400 | $30,900 | $169,500 |
| 2022 | $3,051 | $162,100 | $28,900 | $133,200 |
| 2021 | $2,911 | $154,000 | $26,300 | $127,700 |
| 2020 | $2,971 | $152,100 | $26,300 | $125,800 |
| 2019 | $2,712 | $137,800 | $26,300 | $111,500 |
| 2018 | $2,645 | $134,400 | $26,300 | $108,100 |
| 2017 | $2,548 | $129,600 | $24,300 | $105,300 |
| 2016 | $2,410 | $122,600 | $24,300 | $98,300 |
| 2015 | $2,341 | $119,000 | $24,300 | $94,700 |
Source: Public Records
Map
Nearby Homes
Your Personal Tour Guide
Ask me questions while you tour the home.