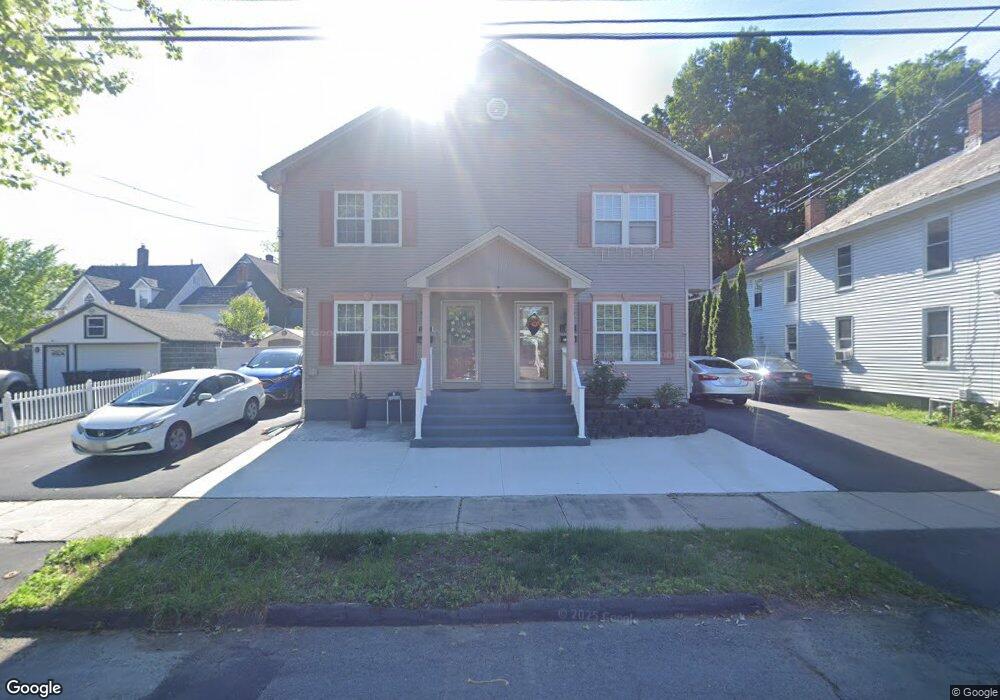
21 Kellogg St Unit B Westfield, MA 01085
Estimated Value: $248,000 - $330,000
3
Beds
2
Baths
1,632
Sq Ft
$182/Sq Ft
Est. Value
About This Home
This home is located at 21 Kellogg St Unit B, Westfield, MA 01085 and is currently estimated at $296,505, approximately $181 per square foot. 21 Kellogg St Unit B is a home located in Hampden County with nearby schools including Westfield High School and Saint Mary High School.
Ownership History
Date
Name
Owned For
Owner Type
Purchase Details
Closed on
Sep 14, 2010
Sold by
Hsbc Bank Usa
Bought by
Kuliak Sergii and Kuliak Tetiana
Current Estimated Value
Home Financials for this Owner
Home Financials are based on the most recent Mortgage that was taken out on this home.
Original Mortgage
$107,800
Outstanding Balance
$71,580
Interest Rate
4.55%
Mortgage Type
Purchase Money Mortgage
Estimated Equity
$224,925
Purchase Details
Closed on
Apr 16, 2010
Sold by
Brady Marc A
Bought by
Hsbc Bank Usa
Purchase Details
Closed on
Dec 3, 2004
Sold by
In John Michael Joseph
Bought by
Brady Marc A
Home Financials for this Owner
Home Financials are based on the most recent Mortgage that was taken out on this home.
Original Mortgage
$134,048
Interest Rate
5.69%
Mortgage Type
Purchase Money Mortgage
Create a Home Valuation Report for This Property
The Home Valuation Report is an in-depth analysis detailing your home's value as well as a comparison with similar homes in the area
Home Values in the Area
Average Home Value in this Area
Purchase History
| Date | Buyer | Sale Price | Title Company |
|---|---|---|---|
| Kuliak Sergii | $140,000 | -- | |
| Hsbc Bank Usa | $212,000 | -- | |
| Brady Marc A | $167,560 | -- |
Source: Public Records
Mortgage History
| Date | Status | Borrower | Loan Amount |
|---|---|---|---|
| Open | Kuliak Sergii | $107,800 | |
| Previous Owner | Brady Marc A | $134,048 | |
| Previous Owner | Brady Marc A | $33,512 |
Source: Public Records
Tax History
| Year | Tax Paid | Tax Assessment Tax Assessment Total Assessment is a certain percentage of the fair market value that is determined by local assessors to be the total taxable value of land and additions on the property. | Land | Improvement |
|---|---|---|---|---|
| 2025 | $3,452 | $227,400 | $0 | $227,400 |
| 2024 | $3,392 | $212,400 | $0 | $212,400 |
| 2023 | $3,225 | $189,900 | $0 | $189,900 |
| 2022 | $3,173 | $171,600 | $0 | $171,600 |
| 2021 | $3,181 | $168,500 | $0 | $168,500 |
| 2020 | $3,088 | $160,400 | $0 | $160,400 |
| 2019 | $3,029 | $154,000 | $0 | $154,000 |
| 2018 | $2,981 | $154,000 | $0 | $154,000 |
| 2017 | $2,991 | $154,000 | $0 | $154,000 |
| 2016 | $2,994 | $154,000 | $0 | $154,000 |
| 2015 | $3,013 | $162,500 | $0 | $162,500 |
| 2014 | $2,954 | $162,500 | $0 | $162,500 |
Source: Public Records
Map
Nearby Homes
- 19 Kellogg St
- 205 Elm St
- 13 Hampden St
- 13 Green Ave
- 25 King St
- 32 Allen Ave
- 97 Mechanic St
- Lot 5 Montgomery
- 9 Montgomery St
- 100 Meadow St
- 114 Otis St Unit C
- 25 Coolidge Ave
- 88 Woodmont St
- 145 Main St
- 180 Russell Rd
- 16 Squawfield Rd
- 238 Prospect Street Extension
- 85 Granville Rd
- 70 S Maple St
- 0 Lockhouse Rd Unit 73496193
- 21 Kellogg St Unit A
- 21 Kellogg St Unit 21 B
- 21 Kellogg St Unit 21 A
- 25 Kellogg St
- 64 Orange St
- 22 Kellogg St
- 16 Conner Ave
- 15 Kellogg St
- 62 Orange St
- 14 Conner Ave
- 26 Kellogg St
- 67 Orange St
- 16 Kellogg St
- 11 Kellogg St
- 5 Lincoln St
- 70 Orange St
- 57 Orange St
- 10 Conner Ave
- 9 Kellogg St
- 9 Kellogg St Unit 2
Your Personal Tour Guide
Ask me questions while you tour the home.