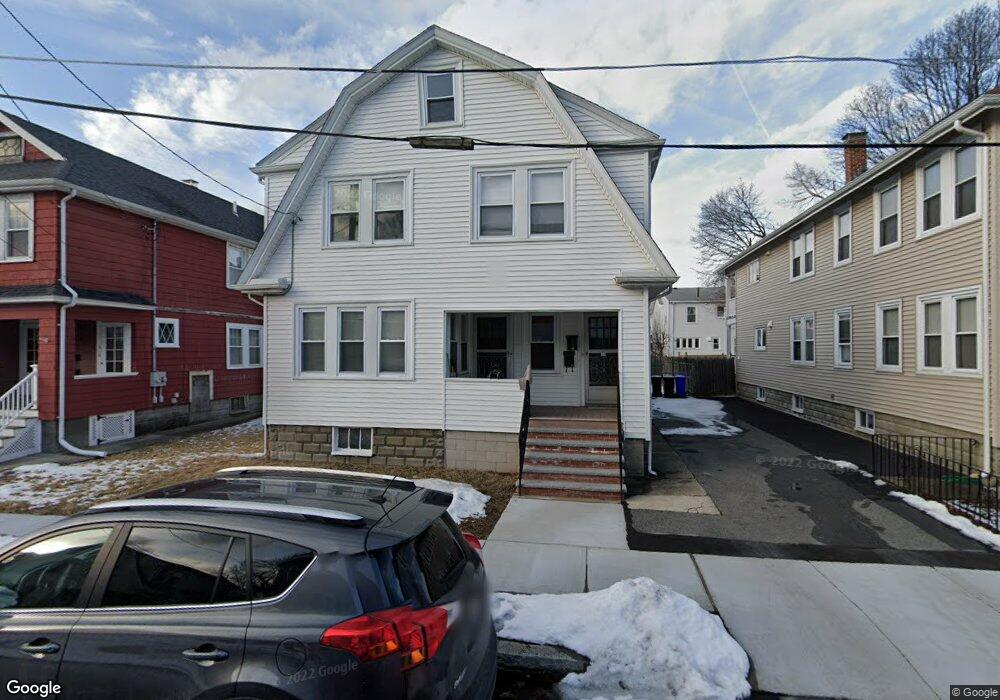
21 Kenmore Rd Unit 23 Malden, MA 02148
Oak Grove NeighborhoodEstimated Value: $910,000 - $1,097,000
5
Beds
2
Baths
2,450
Sq Ft
$392/Sq Ft
Est. Value
About This Home
This home is located at 21 Kenmore Rd Unit 23, Malden, MA 02148 and is currently estimated at $960,352, approximately $391 per square foot. 21 Kenmore Rd Unit 23 is a home located in Middlesex County with nearby schools including Malden High School and Cheverus Catholic School.
Ownership History
Date
Name
Owned For
Owner Type
Purchase Details
Closed on
Dec 2, 2024
Sold by
Liu Yan W and Mei Yue G
Bought by
Liu Ft and Liu
Current Estimated Value
Purchase Details
Closed on
Nov 4, 1997
Sold by
Palmer Marilyn A
Bought by
Liu Yan Wen and Meil Yue Gui
Home Financials for this Owner
Home Financials are based on the most recent Mortgage that was taken out on this home.
Original Mortgage
$90,000
Interest Rate
7.31%
Mortgage Type
Purchase Money Mortgage
Purchase Details
Closed on
Jul 14, 1989
Sold by
Palmer Dennis R
Bought by
Palmer Dennis R
Home Financials for this Owner
Home Financials are based on the most recent Mortgage that was taken out on this home.
Original Mortgage
$106,000
Interest Rate
10.39%
Mortgage Type
Purchase Money Mortgage
Create a Home Valuation Report for This Property
The Home Valuation Report is an in-depth analysis detailing your home's value as well as a comparison with similar homes in the area
Home Values in the Area
Average Home Value in this Area
Purchase History
| Date | Buyer | Sale Price | Title Company |
|---|---|---|---|
| Liu Ft | -- | None Available | |
| Liu Yan Wen | $189,000 | -- | |
| Liu Yan Wen | $189,000 | -- | |
| Palmer Dennis R | $92,700 | -- | |
| Palmer Dennis R | $92,700 | -- |
Source: Public Records
Mortgage History
| Date | Status | Borrower | Loan Amount |
|---|---|---|---|
| Previous Owner | Palmer Dennis R | $90,000 | |
| Previous Owner | Palmer Dennis R | $162,000 | |
| Previous Owner | Palmer Dennis R | $106,000 |
Source: Public Records
Tax History Compared to Growth
Tax History
| Year | Tax Paid | Tax Assessment Tax Assessment Total Assessment is a certain percentage of the fair market value that is determined by local assessors to be the total taxable value of land and additions on the property. | Land | Improvement |
|---|---|---|---|---|
| 2025 | $89 | $789,200 | $308,800 | $480,400 |
| 2024 | $8,639 | $739,000 | $287,000 | $452,000 |
| 2023 | $8,357 | $685,600 | $261,300 | $424,300 |
| 2022 | $8,048 | $651,700 | $241,500 | $410,200 |
| 2021 | $7,829 | $637,000 | $226,800 | $410,200 |
| 2020 | $7,553 | $597,100 | $216,100 | $381,000 |
| 2019 | $7,208 | $543,200 | $205,900 | $337,300 |
| 2018 | $7,156 | $507,900 | $190,000 | $317,900 |
| 2017 | $7,718 | $544,700 | $182,100 | $362,600 |
| 2016 | $5,774 | $380,900 | $160,300 | $220,600 |
| 2015 | $5,576 | $354,500 | $152,400 | $202,100 |
| 2014 | $5,218 | $324,100 | $138,600 | $185,500 |
Source: Public Records
Map
Nearby Homes
- 921 Main St
- 1 Glenwood St Unit 3
- 1 Glenwood St Unit 4
- 1 Glenwood St Unit 5
- 55 Vernon St
- 23 Orient St
- 91-93 Beltran St
- 131 Linden Ave
- 30 Wallace Cir
- 38 Greystone Rd
- 94 Mount Vernon St Unit 94
- 35-41 Brazil St
- 20 Washington Place
- 11 Starbird St
- 30-32 Starbird St
- 29 Lincoln St
- 11-13 Hudson St
- 14 Holm Ct Unit 2
- 41 Mountain Ave
- 62 Wolcott St
- 21-23 Kenmore Rd
- 25 Kenmore Rd Unit 27
- 27 Kenmore Rd Unit Kenmore first floor
- 17 Kenmore Rd Unit 19
- 24 Rosemont St
- 11 Kenmore Rd Unit 13
- 11 Kenmore Rd Unit 2
- 11 Kenmore Rd
- 28 Rosemont St
- 18 Rosemont St
- 22 Kenmore Rd Unit 24
- 26 Kenmore Rd Unit 28
- 18 Kenmore Rd Unit 20
- 18 Kenmore Rd Unit 2
- 20 Kenmore Rd Unit 1
- 28 Autumn St
- 14 Rosemont St
- 32 Autumn St
- 24 Autumn St
- 12 Kenmore Rd Unit 14