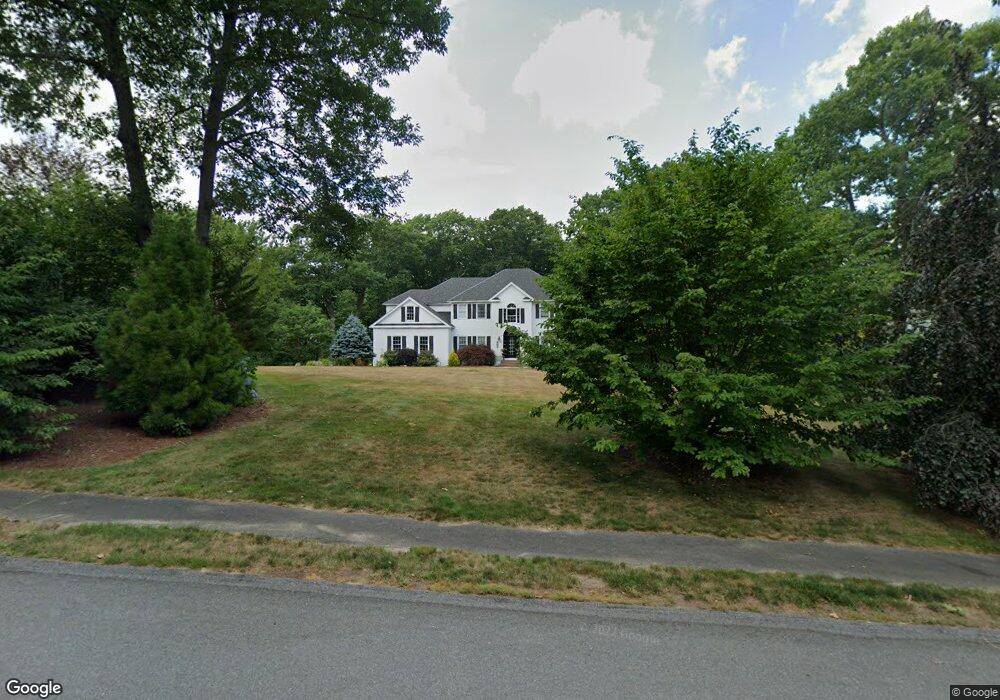
21 Kimball Rd Hopkinton, MA 01748
Estimated Value: $1,377,786 - $1,497,000
4
Beds
3
Baths
4,100
Sq Ft
$346/Sq Ft
Est. Value
About This Home
This home is located at 21 Kimball Rd, Hopkinton, MA 01748 and is currently estimated at $1,417,447, approximately $345 per square foot. 21 Kimball Rd is a home located in Middlesex County with nearby schools including Marathon Elementary School, Hopkins Elementary School, and Elmwood Elementary School.
Ownership History
Date
Name
Owned For
Owner Type
Purchase Details
Closed on
Aug 27, 2004
Sold by
Rota Michael W and Rota Susan E
Bought by
Schmidt Kevin A and Schmidt Lynda M
Current Estimated Value
Home Financials for this Owner
Home Financials are based on the most recent Mortgage that was taken out on this home.
Original Mortgage
$608,000
Interest Rate
6.02%
Mortgage Type
Purchase Money Mortgage
Purchase Details
Closed on
Mar 15, 2002
Sold by
Taylor Elizabeth Sj and Taylor Jeffrey M
Bought by
Rota Michael W and Rota Susan E
Home Financials for this Owner
Home Financials are based on the most recent Mortgage that was taken out on this home.
Original Mortgage
$504,000
Interest Rate
7.04%
Mortgage Type
Purchase Money Mortgage
Purchase Details
Closed on
May 31, 1996
Sold by
Levitan Richard J and Levitan Theresa A
Bought by
Taylor Elizabeth S and Taylor Jeffrey M
Purchase Details
Closed on
Aug 17, 1994
Sold by
Heavner Constr Inc
Bought by
Levitan Richard J and Levitan Therese A
Purchase Details
Closed on
Apr 5, 1991
Sold by
Adlean Dev Corp
Bought by
Heavner Constr Inc
Create a Home Valuation Report for This Property
The Home Valuation Report is an in-depth analysis detailing your home's value as well as a comparison with similar homes in the area
Home Values in the Area
Average Home Value in this Area
Purchase History
| Date | Buyer | Sale Price | Title Company |
|---|---|---|---|
| Schmidt Kevin A | $760,000 | -- | |
| Rota Michael W | $630,000 | -- | |
| Taylor Elizabeth S | $365,000 | -- | |
| Levitan Richard J | $340,800 | -- | |
| Heavner Constr Inc | $87,500 | -- |
Source: Public Records
Mortgage History
| Date | Status | Borrower | Loan Amount |
|---|---|---|---|
| Open | Heavner Constr Inc | $552,000 | |
| Closed | Schmidt Kevin A | $608,000 | |
| Previous Owner | Heavner Constr Inc | $504,000 |
Source: Public Records
Tax History Compared to Growth
Tax History
| Year | Tax Paid | Tax Assessment Tax Assessment Total Assessment is a certain percentage of the fair market value that is determined by local assessors to be the total taxable value of land and additions on the property. | Land | Improvement |
|---|---|---|---|---|
| 2025 | $16,747 | $1,181,000 | $417,300 | $763,700 |
| 2024 | $15,435 | $1,056,500 | $397,200 | $659,300 |
| 2023 | $14,009 | $886,100 | $326,200 | $559,900 |
| 2022 | $13,764 | $808,200 | $296,600 | $511,600 |
| 2021 | $13,382 | $783,500 | $287,900 | $495,600 |
| 2020 | $12,785 | $760,100 | $280,900 | $479,200 |
| 2019 | $12,924 | $752,700 | $275,700 | $477,000 |
| 2018 | $12,278 | $726,500 | $262,600 | $463,900 |
| 2017 | $11,839 | $704,700 | $255,000 | $449,700 |
| 2016 | $11,693 | $686,600 | $250,000 | $436,600 |
| 2015 | $11,660 | $649,200 | $242,600 | $406,600 |
Source: Public Records
Map
Nearby Homes
- 11 Kimball Rd
- 180 Ash St
- 10 Oak St
- 20 Davenport Ln Unit 20
- 52 S Mill St
- 5 Myrtle Ave Unit 2
- 7 Davenport Ln Unit 7
- 7 Myrtle Ave Unit 3
- 13 Fitch Ave
- 13 Fitch Ave Unit 19
- 16 Fitch Ave Unit 6
- 2 Emerald Dr
- 11 Fitch Ave Unit 18
- 14 Fitch Ave Unit 7
- 12 Fitch Ave Unit 8
- 10 Fitch Ave Unit 9
- Stockbridge Plan at Newbury Glen
- Williamstown Plan at Newbury Glen
- Silverbrook Plan at Newbury Glen
- Dickinson Plan at Newbury Glen