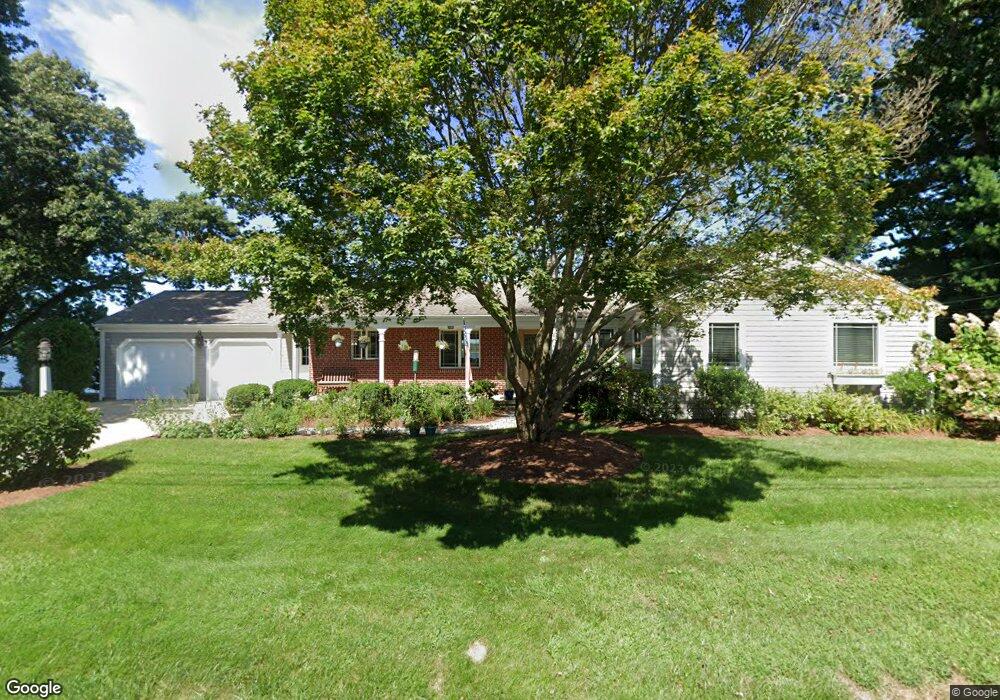
21 Knapton St Barrington, RI 02806
Hampden Meadows NeighborhoodEstimated Value: $995,000 - $1,718,000
3
Beds
2
Baths
3,015
Sq Ft
$464/Sq Ft
Est. Value
About This Home
This home is located at 21 Knapton St, Barrington, RI 02806 and is currently estimated at $1,399,752, approximately $464 per square foot. 21 Knapton St is a home located in Bristol County with nearby schools including Barrington High School, Barrington Christian Academy, and St. Andrews School.
Ownership History
Date
Name
Owned For
Owner Type
Purchase Details
Closed on
Apr 27, 2022
Sold by
Ginsberg Lawrence T and Ginsberg Susan G
Bought by
Lawrence T Ginsberg Ret
Current Estimated Value
Purchase Details
Closed on
Jun 5, 2008
Sold by
Maylor David A
Bought by
Ginsberg Lawrence and Ginsberg Susan
Home Financials for this Owner
Home Financials are based on the most recent Mortgage that was taken out on this home.
Original Mortgage
$250,000
Interest Rate
6.13%
Create a Home Valuation Report for This Property
The Home Valuation Report is an in-depth analysis detailing your home's value as well as a comparison with similar homes in the area
Home Values in the Area
Average Home Value in this Area
Purchase History
| Date | Buyer | Sale Price | Title Company |
|---|---|---|---|
| Lawrence T Ginsberg Ret | -- | None Available | |
| Ginsberg Lawrence | $840,000 | -- |
Source: Public Records
Mortgage History
| Date | Status | Borrower | Loan Amount |
|---|---|---|---|
| Previous Owner | Ginsberg Lawrence | $291,000 | |
| Previous Owner | Ginsberg Lawrence | $332,000 | |
| Previous Owner | Ginsberg Lawrence | $250,000 | |
| Previous Owner | Ginsberg Lawrence | $417,000 |
Source: Public Records
Tax History
| Year | Tax Paid | Tax Assessment Tax Assessment Total Assessment is a certain percentage of the fair market value that is determined by local assessors to be the total taxable value of land and additions on the property. | Land | Improvement |
|---|---|---|---|---|
| 2025 | $20,187 | $1,316,000 | $817,000 | $499,000 |
| 2024 | $19,411 | $1,316,000 | $817,000 | $499,000 |
| 2023 | $18,534 | $913,000 | $582,000 | $331,000 |
| 2022 | $17,940 | $913,000 | $582,000 | $331,000 |
| 2021 | $17,484 | $913,000 | $582,000 | $331,000 |
| 2020 | $17,243 | $825,000 | $518,000 | $307,000 |
| 2019 | $16,583 | $825,000 | $518,000 | $307,000 |
| 2018 | $16,088 | $825,000 | $518,000 | $307,000 |
| 2017 | $15,162 | $758,100 | $494,300 | $263,800 |
| 2016 | $13,987 | $758,100 | $494,300 | $263,800 |
| 2015 | $13,835 | $758,100 | $494,300 | $263,800 |
| 2014 | $14,040 | $767,200 | $454,200 | $313,000 |
Source: Public Records
Map
Nearby Homes
- 367 New Meadow Rd
- 23 Hanson Rd
- 1 Massasoit Ave
- 15 George w Finnerty Rd
- 292 Sowams Rd
- 1741 Wampanoag Trail
- 20 Burr Ave
- 3 Pine Top Rd
- 351 County Rd
- 0 Pinetop Rd
- 26 Tiffany Cir
- 34 Palmer River Rd
- 154 Lincoln Ave
- 9 Lillis Ave
- 0 Lillis Ave
- 11 Elton Rd
- 53 Whipple Ave
- 0 Hampden St
- 381 Maple Ave
- 6 Hazelton Rd
Your Personal Tour Guide
Ask me questions while you tour the home.