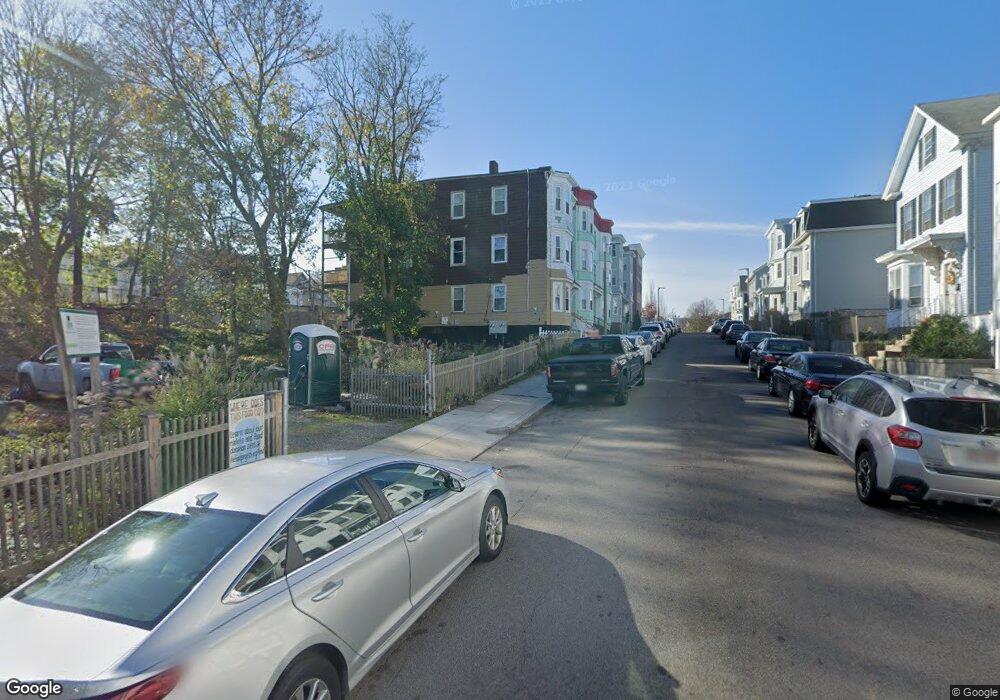
21 Langdon St Roxbury, MA 02119
Dudley-Brunswick King NeighborhoodEstimated Value: $990,000 - $1,118,000
8
Beds
3
Baths
3,081
Sq Ft
$343/Sq Ft
Est. Value
About This Home
This home is located at 21 Langdon St, Roxbury, MA 02119 and is currently estimated at $1,056,667, approximately $342 per square foot. 21 Langdon St is a home located in Suffolk County with nearby schools including Dudley Street Neighborhood Charter School and Pope John Paul II Catholic Academy Columbia Campus.
Ownership History
Date
Name
Owned For
Owner Type
Purchase Details
Closed on
Feb 26, 1999
Sold by
Louzada Lamuel O and Louzada Juvencia B
Bought by
Moeda Jose L
Current Estimated Value
Home Financials for this Owner
Home Financials are based on the most recent Mortgage that was taken out on this home.
Original Mortgage
$72,000
Outstanding Balance
$17,470
Interest Rate
6.78%
Mortgage Type
Purchase Money Mortgage
Estimated Equity
$1,039,197
Create a Home Valuation Report for This Property
The Home Valuation Report is an in-depth analysis detailing your home's value as well as a comparison with similar homes in the area
Home Values in the Area
Average Home Value in this Area
Purchase History
| Date | Buyer | Sale Price | Title Company |
|---|---|---|---|
| Moeda Jose L | $80,000 | -- |
Source: Public Records
Mortgage History
| Date | Status | Borrower | Loan Amount |
|---|---|---|---|
| Open | Moeda Jose L | $72,000 |
Source: Public Records
Tax History Compared to Growth
Tax History
| Year | Tax Paid | Tax Assessment Tax Assessment Total Assessment is a certain percentage of the fair market value that is determined by local assessors to be the total taxable value of land and additions on the property. | Land | Improvement |
|---|---|---|---|---|
| 2025 | $7,430 | $641,600 | $182,200 | $459,400 |
| 2024 | $6,637 | $608,900 | $189,000 | $419,900 |
| 2023 | $5,840 | $543,800 | $168,800 | $375,000 |
| 2022 | $5,745 | $528,000 | $163,900 | $364,100 |
| 2021 | $5,266 | $493,500 | $153,200 | $340,300 |
| 2020 | $5,023 | $475,700 | $171,500 | $304,200 |
| 2019 | $4,360 | $413,700 | $107,300 | $306,400 |
| 2018 | $3,871 | $369,400 | $107,300 | $262,100 |
| 2017 | $3,622 | $342,000 | $107,300 | $234,700 |
| 2016 | $3,271 | $297,400 | $107,300 | $190,100 |
| 2015 | $3,365 | $277,900 | $84,600 | $193,300 |
| 2014 | $3,393 | $269,700 | $84,600 | $185,100 |
Source: Public Records
Map
Nearby Homes
- 24 Clarence St Unit 24R
- 92 George St Unit 203
- 69 Burrell St
- 108 Mount Pleasant Ave Unit 108R
- 29 E Cottage St
- 14 Robey St Unit 14
- 101 Mount Pleasant Ave
- 80 Blue Hill Ave Unit 5
- 620 Dudley St
- 45 Woodville St
- 102-104 Robey St
- 79 W Cottage St
- 21 Dean St
- 12 Gayland St
- 119 Blue Hill Ave
- 2 Mount Pleasant Place Unit 2
- 33 Copeland Park Unit C
- 22 Alaska St
- Lot 84 Blue Hill Ave
- 133 Blue Hill Ave
- 19 Langdon St
- 25 Langdon St
- 17 Langdon St
- 17 Langdon St Unit 17 Langdon St
- 17 Langdon St
- 17 Langdon St Unit 2
- 17 Langdon St Unit 1
- 17 Langdon St Unit 1-6
- 15 Langdon St
- 15 Langdon St Unit 15-1
- 15 Langdon St Unit 15-2
- 15 Langdon St Unit 17
- 15 Langdon St Unit 17-2
- 15 Langdon St Unit 17-1
- 15 Langdon St
- 15 Langdon St Unit 2
- 15 Langdon St Unit 1-6
- 2-15 Langdon St
- 15-17 Langdon St Unit 15-1
- 15-17 Langdon St