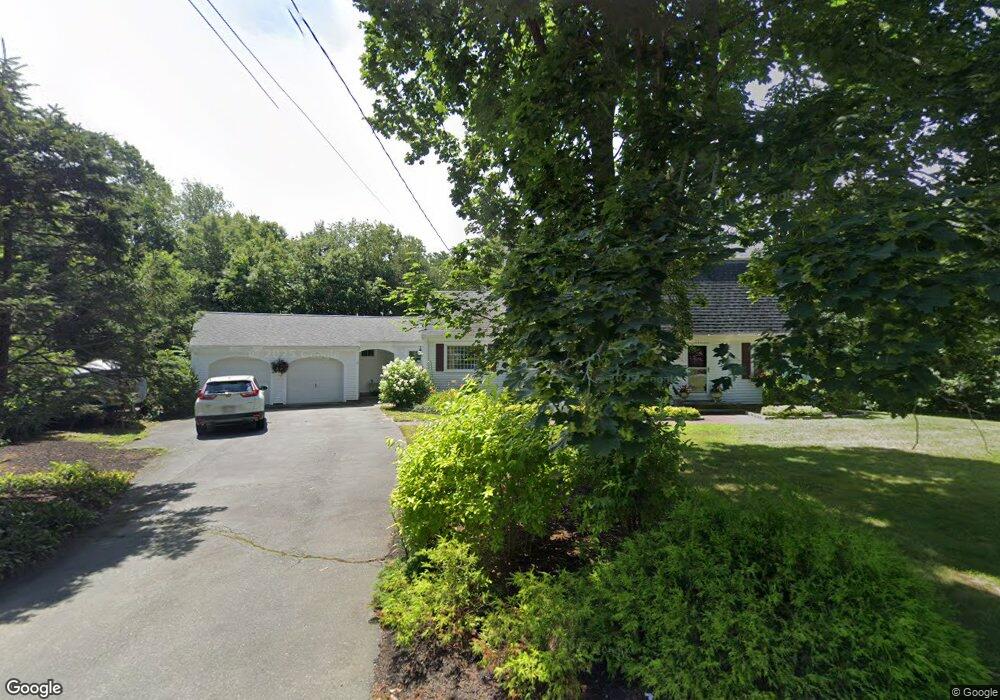
21 Lebaron Way Mattapoisett, MA 02739
Estimated Value: $737,000 - $940,000
3
Beds
2
Baths
2,465
Sq Ft
$336/Sq Ft
Est. Value
About This Home
This home is located at 21 Lebaron Way, Mattapoisett, MA 02739 and is currently estimated at $827,816, approximately $335 per square foot. 21 Lebaron Way is a home located in Plymouth County with nearby schools including Center School, Old Hammondtown Elementary, and Old Rochester Regional High School.
Ownership History
Date
Name
Owned For
Owner Type
Purchase Details
Closed on
Jun 11, 2020
Sold by
Mcswiggan Wayne E and Mcswiggan Gail J
Bought by
Mcswiggan Ft and Mcswiggan
Current Estimated Value
Purchase Details
Closed on
Sep 23, 1987
Sold by
Denniston Grant
Bought by
Mcswiggan Wayne E
Create a Home Valuation Report for This Property
The Home Valuation Report is an in-depth analysis detailing your home's value as well as a comparison with similar homes in the area
Home Values in the Area
Average Home Value in this Area
Purchase History
| Date | Buyer | Sale Price | Title Company |
|---|---|---|---|
| Mcswiggan Ft | -- | None Available | |
| Mcswiggan Ft | -- | None Available | |
| Mcswiggan Wayne E | $239,000 | -- |
Source: Public Records
Mortgage History
| Date | Status | Borrower | Loan Amount |
|---|---|---|---|
| Previous Owner | Mcswiggan Wayne E | $135,000 | |
| Previous Owner | Mcswiggan Wayne E | $160,000 | |
| Previous Owner | Mcswiggan Wayne E | $167,000 |
Source: Public Records
Tax History Compared to Growth
Tax History
| Year | Tax Paid | Tax Assessment Tax Assessment Total Assessment is a certain percentage of the fair market value that is determined by local assessors to be the total taxable value of land and additions on the property. | Land | Improvement |
|---|---|---|---|---|
| 2025 | $7,587 | $705,100 | $234,000 | $471,100 |
| 2024 | $7,411 | $705,100 | $234,000 | $471,100 |
| 2023 | $7,301 | $649,000 | $199,800 | $449,200 |
| 2022 | $7,769 | $626,500 | $166,600 | $459,900 |
| 2021 | $6,844 | $528,100 | $151,400 | $376,700 |
| 2020 | $6,576 | $487,500 | $144,200 | $343,300 |
| 2019 | $6,355 | $481,100 | $144,200 | $336,900 |
| 2018 | $4,953 | $380,400 | $127,600 | $252,800 |
| 2017 | $4,869 | $372,500 | $140,400 | $232,100 |
| 2016 | $4,772 | $361,500 | $134,000 | $227,500 |
| 2015 | $4,661 | $358,500 | $137,900 | $220,600 |
| 2014 | $4,479 | $352,100 | $137,900 | $214,200 |
Source: Public Records
Map
Nearby Homes
- 13 Park Place
- 9 Hitching Post Rd
- 19 High Ridge Dr
- 47 Fairhaven Rd
- 35 North St
- 8 Abby Ln
- 7 Laura Ln
- 52 Prince Snow Cir
- 2 Golf Cottage Way
- 4 Golf Cottage Way
- 7 Pearl St
- 12 Cannon St
- 0 Long Plain Rd
- 8 Captains Ln
- 83 Fairhaven Rd
- 11 Captains Ln
- 31 Split Rock Ln
- 3 Brandt Island Rd
- 224 North St
- 15 Ned's Point Rd